3. Sustainable Finance
3.1. Impact of Climate Policy on Financial Performance
3.1.1. Context
In the past few years, many events contributed to fostering a decisive action to reduce greenhouse gas (GHG) emissions: the Paris Agreement, the publication of Sustainable Development Goals, the Special Report of the Intergovernmental Panel on Climate Change (IPCC), the launch of European Commission’s (EC) Action Plan on Financing Sustainable Finance, and, more recently the European Green Deal and the EU Taxonomy. The vision that led nations to participate in the first place relates to the transition to a low-carbon and climate-resilient economy. The EU has agreed on a set of targets for 2030 regarding GHG emission reductions. Among the means to fulfil such an end, there are renewable energy and technologies for energy efficiency. To accelerate the transition, European institutions have approved rules on GHG emissions from land use as well as emissions targets for the automotive sector (for example, Commission Regulation (EU) 2019/318 of 19 February 2019 as regards the determination of the CO2 emissions and fuel consumption of heavy-duty vehicles). One of the most relevant policy actions that the EC has adopted is the launch of the European Green Deal in December 2019. This document tackles different issues, such as reaching climate neutrality by 2050 while abiding by just and inclusive transition principles. However, the main reason for the EU’s commitment and actions is to engage the private sector and activate a leverage effect through private investments. To meet the EU’s energy and climate 2030 targets, an estimated amount of €350 billion per year is needed (Schutze et al., 2020). Nevertheless, further funds are necessary to achieve climate neutrality by 2050. Business opportunities are significant, and the private sector involvement, in terms of commitment and capital investment, appears crucial (Monasterolo, 2020).
However, without evidence of financial performance improvements, the achievement of low-carbon targets could be perceived as costly and economically inefficient.
The failure to achieve GHG emission targets unfolds negative uncertainties. Climate-related risks could severely impact business activities as well as financial institutions. Weather-related disasters caused a record of €283 billion in economic damages in 2017 and could affect up to two-thirds of the European population by 2100 compared with 5% today (European Commission, 2019). Physical damages are just one of the climate-related risks that can affect businesses. The Task Force on Climate-related Financial Disclosure (TCFD) identified the second kind of risk: transition risk. This type of risk is associated with the costs that can arise when moving towards a less polluting, greener economy (i.e., changes in the regulation, demand shifts, etc.), and, together with physical risks, imply a risk for companies to see their assets strand. To provide some figures, CDP (ex-Carbon Disclosure Project) estimated that in the world’s 500 largest companies, the amount reported which are linked to stranded assets totals US$252 billion (CDP). In order to manage this risk, companies need to identify and implement a sound resilience business strategy made of mitigation and adaptation actions.
Moreover, as stated earlier, corporates expect an improvement in their financial performance following the investments in sustainability. For this reason, scholars have begun to study the relationship between corporate environmental performance (CEP) and corporate financial performance (CFP), and several studies have linked the positive relation between CEP and CFP (Fisher-Vanden et al., 2011; Berg et al., 2019; Busch et al., 2011; Qi et al., 2014; Trumpp et al., 2017; Wang et al., 2014; Iwata et al., 2011; Fujii et al., 2013; Delmas et al., 2015). This finding reversed the established conception according to which corporate responsibility is limited to financial performance (Friedman, 1970). However, literature has used different indicators to identify the CEP. ESG ratings, in this sense, were considered a useful variable, as they offered information related to companies’ environmental, social and governance indicators. Indexes composing ESG ratings capture the decision-making choices of the CEOs implicitly, as they are used as guidance and benchmarking (Berg et al., 2019). Previous literature (Kim et al., 2013) notes that disclosure-based measures are better predictors of corporate sustainability performance than performance-based measures. As a matter of fact, considering environmental variables directly related to CEP, such as GHG emissions, waste, water use, etc., provides an alternative strategy to shed light on this issue. The choice of the environmental variables depends on the analyzed sector, the country and on the relevant policy framework. For example, if a country’s economy is heavily reliant on fossil fuels and does not have a rigid GHG regulation, the probability that emission levels will not negatively affect firms’ CFP is high (Wang et al., 2014). For this reason, some kind of conclusions can be drawn at the country (Lyon et al., 2013; Qi et al., 2014) and sector level (Wang et al., 2014), but overall results are too mixed to allow us to draw final conclusions in this respect, mainly because of the heterogeneity of environmental indicators (Berg et al., 2019), and because of the different measurement levels that can be chosen (Aureli et al., 2019; Busch et al., 2011).
The above brief discussion allows us to imagine that there is some sort of link that undergoes CFP and CEP proxied as ESG scores, but still, finance could represent a serious obstacle to the achievement of the climate objectives (Monasterolo, 2020). For this reason, public investment is vital and might play an important role as a driver of the low-carbon transition (Monasterolo, 2020; Wolf et al., 2021).
Uncertainties regarding the impact of climate change and climate policy, the lack of a standardized taxonomy of sustainable investments (Cullen, 2018; Monasterolo et al., 2020), and the low degree of transparency of sustainable financial instruments (Berg et al., 2019; Busch et al., 2020) are identified as the major barriers, alongside the consequences of a « disorderly » transition.
Starting from the Paris Agreement, institutions began to set up policy actions aimed at achieving the climate goals. In this context, the EC has demonstrated its commitment by promoting initiatives always more refined and ambitious (i.e., the Directive 95/2014/EU on mandatory non-financial reporting, the European Green Deal, the EU Taxonomy Regulation, and the Corporate Sustainability Reporting Directive proposal).
As part of the action plan on financing sustainable growth, in spring 2019, the European Commission adopted a regulation on disclosure relating to sustainable investments and sustainability risks (SFRD), laying down disclosure obligations for manufacturers of financial products and financial advisers towards end-investors. The purpose is to integrate sustainability risks in investment processes and for financial products that pursue the objective of sustainable investment.
As a consequence, the European Commission identified the necessity to define a common language and clarify what can be considered a «sustainable activity». The EU Taxonomy classification system, defined in the Taxonomy Regulation, entered into force on 12 July 2020, sets out the conditions that economic activity has to meet in order to qualify as environmentally sustainable.
The Regulation establishes six objectives, and each economic activity, in order to comply, needs to contribute substantially to at least one of them without causing significant harm to all the remaining environmental objectives.
The Corporate Sustainability Reporting Directive (CSRD) is a regulation proposal promoted by the European Commission aimed at innovating and integrating the obligations included in the Non-financial Reporting Directive (NFRD), incorporating at the same time the recommendations suggested by the Task Force on Climate-related Financial Disclosure (TCFD).
The CSRD intends to:
-
Guarantee to the stakeholders, typically the financial market operators, that the corporate’s sustainability reporting is aligned to their needs;
-
Communicate to the stakeholders the information related to the corporate’s sustainability business strategy, the financial impacts of climate-related risks and opportunities on the company’s business and vice versa;
-
Guarantee the coherence of the information included in corporate’s climate disclosure and the information obligations established by the EU Taxonomy;
-
Widen the application scope of the Directive by including the SMEs;
-
Increase the quality of the data;
The Directive 95/2014/EU
In November 2014, the EC approved Directive 95/2014/EU, which describes the kind of information that firms in scope need to provide in their non-financial reporting document.
As mentioned before, the policy’s main objective is to increase the quality and the consistency of corporate’s non-financial information, enhance comparability across different companies, and improve the trust and the confidence of investors and stakeholders (Nicolò et al., 2020).
The directive states that undertakings shall provide “(a) a brief description of the undertaking’s business model; (b) a description of the policies pursued by the undertaking in relation to those matters, including due diligence processes implemented; © the outcome of those policies; (d) the principal risks related to those matters linked to the undertaking’s operations including, where relevant and proportionate, its business relationships, products or services which are likely to cause adverse impacts in those areas, and how the undertaking manages those risks; (e) non-financial key performance indicators relevant to the particular business” (European Commission, 2014).
The Commission did not specify any kind of form of the report to provide this information. As a matter of fact, the companies can choose to publish a separate non-financial statement or include such information in their annual reports.
Finally, also the choice of the reporting framework is discretionary. Firms may adopt any framework they believe to be more suitable (national, European, or recognized international frameworks), provided that such a choice is duly indicated.
The EU Taxonomy
To achieve the climate goals adopted, the European Commission introduced, in July 2019, the European Green Deal, which relies on several actions, in particular on the Action Plan on Financing Sustainable Growth and its EU Taxonomy. The latter measure has been built in order to address some specific and fundamental barriers that have been identified for the achievement of the sustainability goals, such as transparency, data quality and comparability (Monasterolo, 2020). In particular, the final regulation (Regulation (EU) 2020/852) identifies “sustainable economic activities” according to three criteria:
-
their contribution to at least one of six environmental goals[1] (passing specific thresholds);
-
the respect of the do-not-significant-harm clause with respect to the six environmental goals;
-
compliance with the minimum safeguards.
In general, the taxonomy can be applied at two levels: the firm level and the project level. At the firm level, a company can be evaluated based on its sales or expenses that correspond to the taxonomy (Beerbaum, 2021), while at the project level, the taxonomy can be used to classify new investments.
The Corporate Sustainability Reporting Directive (CSRD)
Following the EU Taxonomy goal of increasing data quality and comparability, in April 2021, the EC launched a new proposal for corporates’ sustainability reporting.
As a matter of fact, the CSRD innovates and integrates the provisions included in the Directive 2014/95/EU, also known as the Non-financial Reporting Directive (NFRD), which entered into force in 2018 and incorporated the recommendations set by the Task Force on Climate-related Financial Disclosure (TCFD).
However, the proposal’s aims also to guarantee that corporate reporting is aligned to stakeholders’ needs and to communicate valuable information on corporate’s sustainable business strategy, the financial impact of climate-related risks and opportunities on companies’ business and vice versa (double materiality). Naturally, the information included in corporate climate disclosure is coherent with the ones required by the EU Taxonomy.
The Directive will be applicable to all listed and non-listed large European companies and to companies (European and non-European) listed on European markets. The application scope should now cover 49.000 companies. The disclosure will have to be part of the annual report, requiring companies to digitally ‘tag’ the reported information, so it is machine-readable and feeds into the European single access point envisaged in the capital markets union action plan. The reporting framework will have to consider the following factors: (i) Environmental, (ii) Social, and (iii) Governance.
Climate change is, in fact, being progressively recognized as a significant source of risk for the financial system. However, there is still a considerable gap in methodologies to analyze climate-related financial risks due to climate risks specific characteristics such as deep uncertainty, non-linearity, and endogeneity (Battiston et al., 2021; Monasterolo, 2020). In addition, the climate-related financial transmission channels can be amplified due to financial interconnectedness and can have significant feedback effects on the real economy (Figure 6) (Battiston et al., 2021).
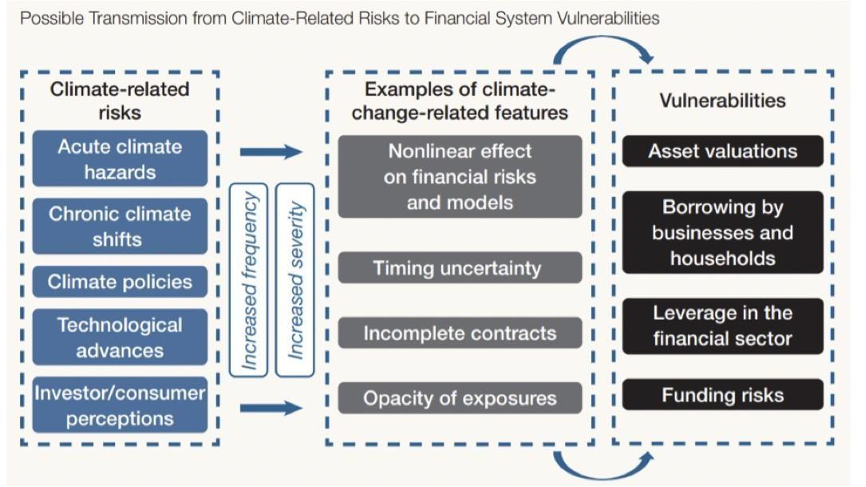
Figure 6 Possible Transmission from Climate-Related Risks to Financial System Vulnerabilities
However, climate policy and finance could represent a driver or a barrier to the low-carbon transition (Monasterolo, 2020). Uncertainties regarding the impact of climate change and climate policy, the lack of a standardized taxonomy of sustainable investments (Cullen, 2018; Monasterolo and Volz, 2020), and the low degree of transparency of sustainable financial instruments (Berg et al., 2019; Busch et al., 2020) are identified as the major barriers, alongside the consequences of a «disorderly» transition.
The EU Taxonomy tackles this first issue, serving as a standard for sustainability labels in the market for private investors and creating more transparency and comparability for end customers, giving businesses, building owners, investors and lending institutions better insights into the climate impact of their investing and financing (Schutze et al., 2020).
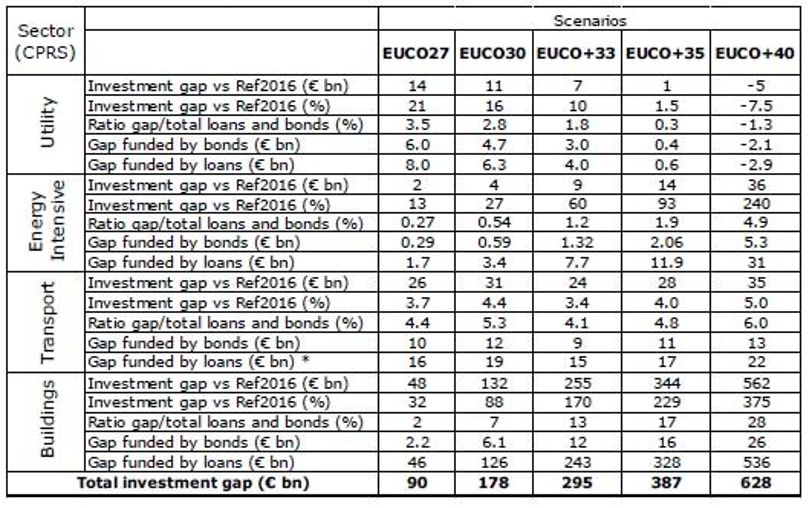
In terms of reducing emissions and achieving targets, a report by JRC states that in the best-case scenario, the EU Taxonomy would help reach the targets (Table 9) (Alessi et al., 2019; Lucarelli et al., 2020).
Table 9 Investment Gap and EU Financial Markets. Estimated breakdown of investment gap financing across CPRS sectors and EUCO scenarios. Source: Alessi et al., 2019
The EU Taxonomy provides better insights on the impact of firms’ and financial operators’ investing and financing, while the CSRD aims to improve data quality but, most importantly, holds companies accountable for their business activities.
There is evidence that information quality increases after the introduction of a legal provision (Caputo et al., 2019) and that legislation stringency facilitates firms to invest in climate change mitigation capabilities (Lee et al., 2015). Moreover, investors do look for an integrated analysis of the impact of CSR activities on key business metrics (Du et al., 2010), preferring long-term sustainability over short-run financial performance (Aureli et al., 2019), and to do so, they rely mainly on CSR/sustainability reports (Cohen et al., 2015). Aureli et al. (2019) also find that firms’ market value does respond to ESG information. However, it mostly depends on the metrics used to define climate performance (Battiston et al., 2021).
3.1.2. Data and methodology
In this frame, we applied a research approach called ‘event analysis’ using the market model as suggested by the relevant literature (Brouwers et al., 2016). The following events were considered:
-
Introduction of Directive 95/2014/EU on mandatory non-financial reporting (22nd October 2014);
-
Taxonomy Regulation published in the Official Journal of the European Union (22nd June 2020);
-
Adoption of the proposal for a Corporate Sustainability Reporting Directive (CSRD) (21st April 2021).
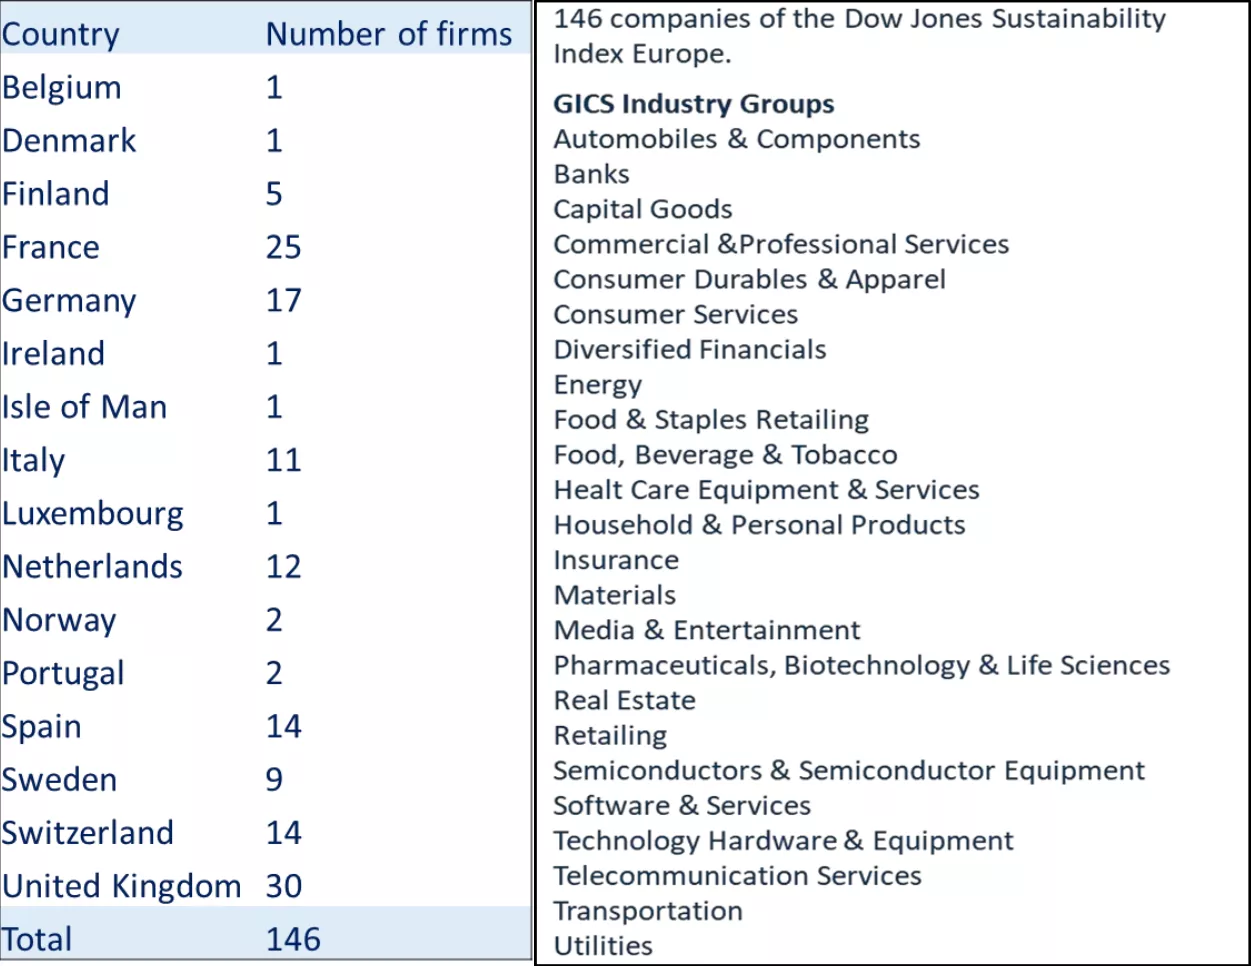
We then econometrically estimated a market model over 90 trading days ending five days prior to the event. The Dow Jones index was used as a market proxy to evaluate the relationship between the individual firm’s stock return and the market (Table 10). Finally, we explored abnormal returns and the cumulative market response over the entire event window.
Table 10 Number of firms per country and types of GISC industry group
3.1.3. Results
The three above-mentioned regulatory events appear to have a significant effect, to a different extent and other time windows. Abnormal returns do not seem important on the event’s day but on subsequent days. Parametric and non-parametric tests have been run to understand if share prices react significantly to the events.
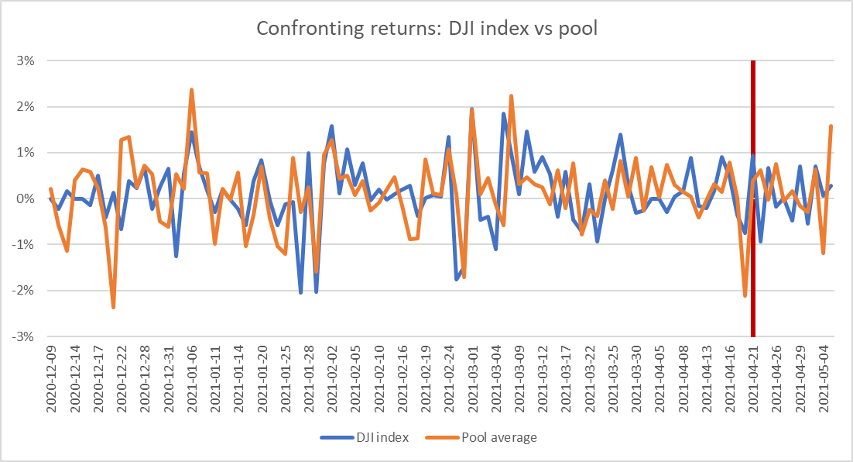
In particular, what stands out is that, on average, the pool’s returns are negative during the event’s date, while the index does show positive performances. However, this is true only for the first two regulatory events, while the third (Adoption of the proposal for a CSRD) provides the opposite evidence.
Figure 7 Confronting returns: DJI index vs pool
3.1.4. Conclusions
The change in the dynamics of market returns throughout time highlights an important aspect: In the past, the most sustainable firms were affected negatively by policy announcements, while now they are the only ones to perform positively in the market when the European Commission adopts a policy action. Lucarelli et al. (2020) state that “… EU Taxonomy-related topics have now been incorporated into policy measures, which reinforces expectations for positive impactful environmental effects”, allowing us to assume that there might be a nexus between firms’ environmental performances and their financial ones. This result could eventually suggest two findings:
-
Climate-related policies became more refined over time, and sustainable firms do benefit from them;
-
For a certain level of environmental performance, firms may perform positively in the markets, but below this level, they might not, even though they are more sustainable than other firms which perform better.
However, this analysis may be expanded by analyzing particularly exposed sectors and implementing additional quantitative methods to identify other relevant variables that might play an important role. Moreover, further research is needed in various areas, particularly concerning the channeling of financial flows and the companies’ strategic choices.
Box 3 – Connection between ESG and financial performance
ESG refers to a broad range of Environmental, Social, and corporate Governance factors that might influence a company’s ability to generate value. It relates to incorporating non-financial elements into business strategy and decision-making in a corporate context. While ESG factors are referred to as non-financial, there are financial implications, as they are linked to corporate competitiveness and profitability.
Companies are increasingly interested in reporting how their activities comply with generally accepted ESG standards. They recognize that apart from an improved reputation, ESG criteria can add value to them and help them become more effective in their operations.
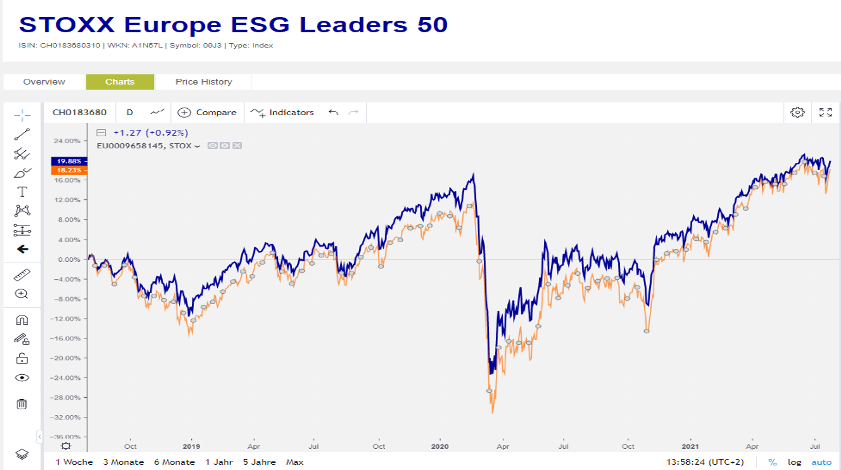
A good ESG performance generally implies excellent financial performance as well. By looking at the behavior of the STOXX Europe ESG Leaders 50 during the last three years, we see that COVID-19 adversely affected this index, as expected. The index fell by almost 42% in just one month (from + 20.67% on 18/2/2020 to -21.89% on 16/3/2020). However, the fall in the EURO STOXX 50 Index’s price was sharper, recording a fall of almost 45% (from + 16.08% to -29.09% in the same period). This fact may indicate a greater resilience of the companies in STOXX Europe ESG Leaders 50 in crises compared to EURO STOXX 50 companies, especially if we consider the overall behavior of the index, which seems to recover faster (Figure 8).
Figure 8 STOXX Europe ESG Leaders 50 (Blue) and EURO STOXX 50 (Orange) development the last three years. Source: Boerse Frankfurt
Koundouri, Pittis and Plataniotis, 2021, performed an empirical examination on whether the adoption of ESG criteria boosts companies’ valuation, reduces the equity risk and makes them more efficient in managing their funds.
They compared STOXX Europe ESG Leaders 50 index companies, namely companies that are global leaders in terms of ESG criteria, to EURO STOXX 50 Index Companies, namely a blue-chip representation of supersector leaders in Europe, in terms of profitability, valuation, capital efficiency and risk.
Using publicly available financial data for each company in the sample, they calculated five indicators: Beta, Total Debt/Equity, Profit Margin, Return on Assets, and Return on Equity on average per sector. These indicators are widely used to assess shareholder risk, capital structure efficiency, profitability and Asset and Equity efficiency and are considered to provide a good overview of the company’s performance profile.
Below are some selected results:
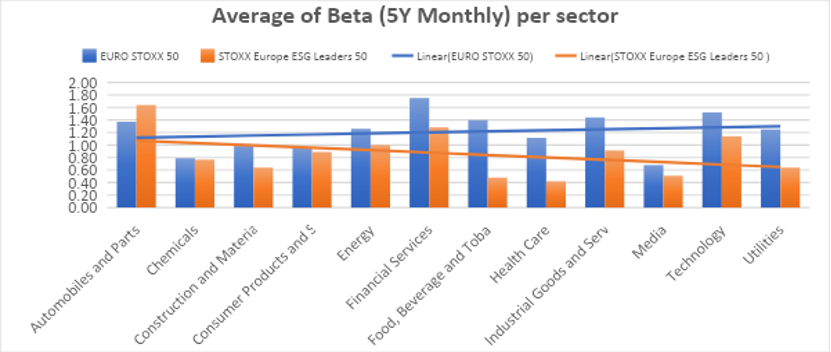
The Beta indicator expresses the volatility, hence the risk, of a stock in the market. A stock with a beta greater than 1.0 shows higher volatility, while a beta less than 1.0 indicates lower volatility than the market over time. Our analysis shows that companies with good ESG performance generally tend to have lower beta and, therefore, lower risk; however, this is not the case for companies in the automotive sector (Figure 9).
Figure 9 Average of Beta (5Y Monthly) per sector
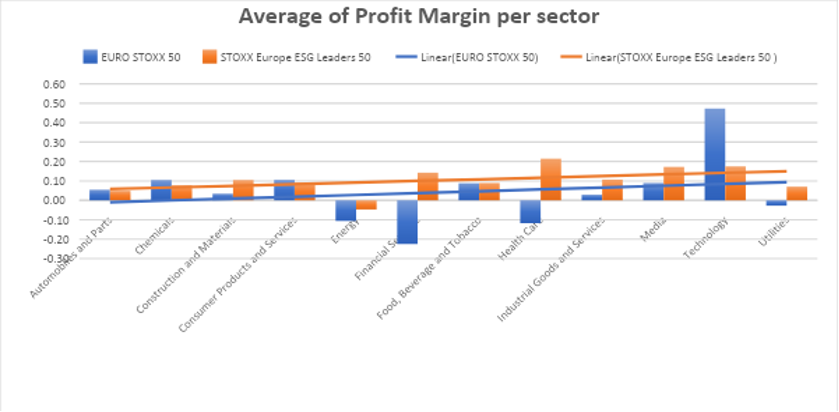
Profit margins are one of the most basic and commonly utilized financial metrics in the business world. A company’s profitability is usually measured at three levels - gross profit, operating profit, and net profit. Although, a strong positive correlation between ESG performance and Profit Margin cannot be argued. In some sectors, ESG leaders seem to have a higher profit margin, while in other sectors, the opposite is true (Figure 10).
Figure 10 Average of Profit Margin per sector
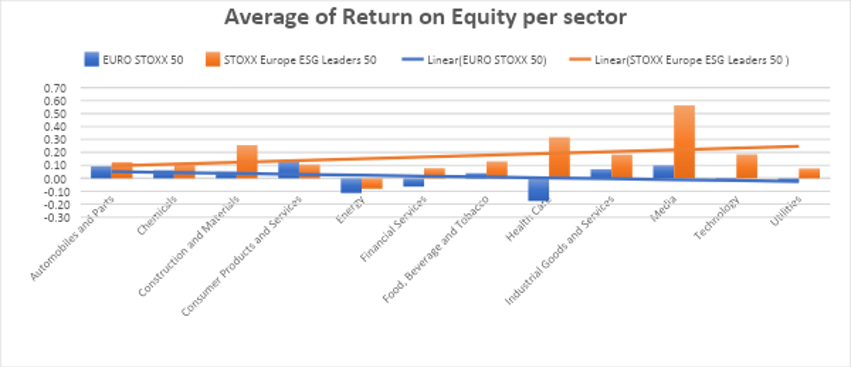
Return on equity (ROE) is a financial performance metric derived by dividing net income by shareholders’ equity. ROE is defined as the return on net assets since shareholders’ equity equals a company’s assets minus its debt. Companies with good ESG performance have a better return on equity than the others; Even in the sectors with negative returns like energy, ESG leaders demonstrate less negative return on equity than the others (Figure 11).
Figure 11 Average Return on Equity per sector
3.2. Valuation of Biodiversity ecosystems
Natural capital refers to the world’s stocks of natural assets such as forests, fisheries, rivers, biodiversity, land and minerals. Biodiversity can be defined as the variability among living organisms from all ecosystems of which they are part, covering richness, rarity and uniqueness. This definition captures both the living and non-living aspects of ecosystems and implies that the elements of nature have value to society (HM Treasury’s Green Book).
Numerous studies have extensively demonstrated the emergency deriving from the loss of biodiversity we are experiencing. However, less evidence has been provided on the changes we need at a political, financial and economic level to slow down and reverse this path Dasgupta (2021).
In this section, we provide a valuation of the European ecosystem services, that is we estimate the Willingness to pay for several classifications of the ecosystem services and various biogeographical and Marine regions across Europe.
3.2.1. Natural Capital and human society
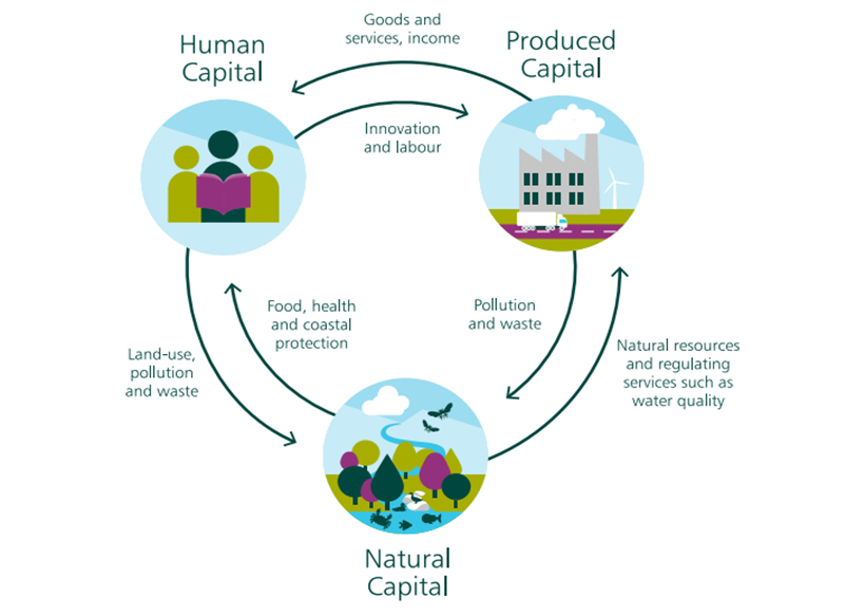
Over time, natural capital stocks provide flows of environmental or ‘ecosystem’ services. These services, which are frequently combined with other types of capital (human, produced, and social), generate various benefits (Figure 12).
A resource’s use value might be either a market value, such as minerals, wood, water and other goods, or a non-market value, such as outdoor recreation, landscape amenity, and many others. Non-use values, such as the importance people attach to specific habitats or species, are also included.
Environmental economists consider nature as a resource from which humans may benefit. The quality, quantity, and location of natural resources greatly influence their potential to produce commodities and services—background forces, management policies, and demand factors all impact these characteristics.
Figure 12 The relationship between different types of Capital. Source: The Dasgupta Review, 2021
3.2.2. Ecosystem services
Biodiversity is a critical component of natural capital because it enables the provision of environmental benefits and services to people. The Convention on Biological Diversity defines biodiversity as “the diversity of living organisms from all sources, including terrestrial, marine, and other aquatic ecosystems, and the ecological complexes to which they belong; this includes diversity within species, between species, and within ecosystems.” (HM Treasury, 2020).
The productivity of natural capital derives from its quality and quantity, in other words, its biodiversity. Therefore, maintaining the stock of this capital constant allows the provision of flows of ecosystem services which depends on human present and future prosperity TEEB (2010).
As a result of humans changing ecosystems, human well-being has been affected, as well as how ecosystem changes may affect people in the future, and what types of responses can be used at local, national, and global scales to improve ecosystem management, which in turn will make humans happier and less poor.
Ecosystem services are final products or results that directly and indirectly affect human well-being, and these factors can work well with an economic strategy. The main reason for valuing ecosystem services is that it will help people make informed decisions. It will make sure that policy decisions consider the costs and benefits of the natural environment and the implications for human well-being while giving policymakers new ideas. Indeed, the term “ecosystem services” indicates the link between natural capital and the economy, which corresponds to the utility people derive from exploiting ecosystems.
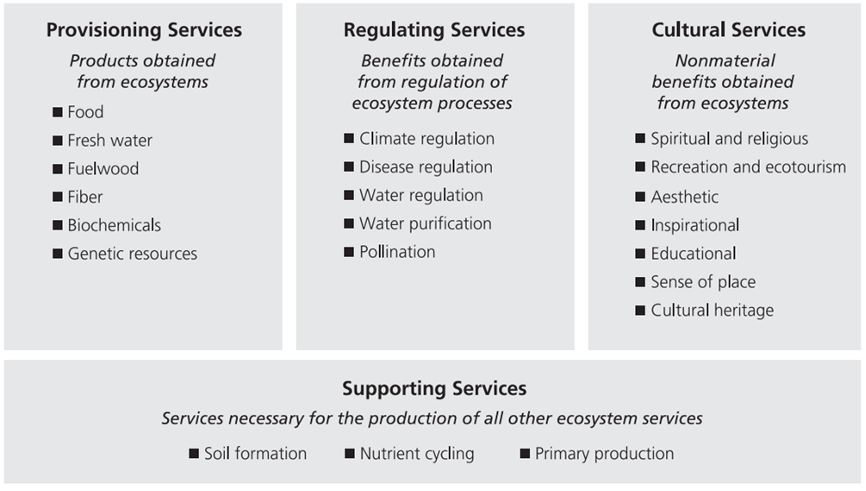
The Millennium Ecosystem Assessment (MA, 2005)[2] has recognized four categories of ecosystem services (Figure 13):
-
Provisioning services: products obtained from ecosystems, e.g. water, food, fibre;
-
Regulating services: benefits guaranteed by the regulation of ecosystem processes, e.g. climate regulation, water regulation, pollination;
-
Cultural services: non-material benefits derived from ecosystems, e.g. recreation, aesthetic, spiritual and religious, cultural heritage
-
Supporting services: services needed to produce all the other ecosystem services, e.g. nutrient cycling, soil formation, primary production.
Figure 13 Ecosystem Services. Source: Millenium Assessment
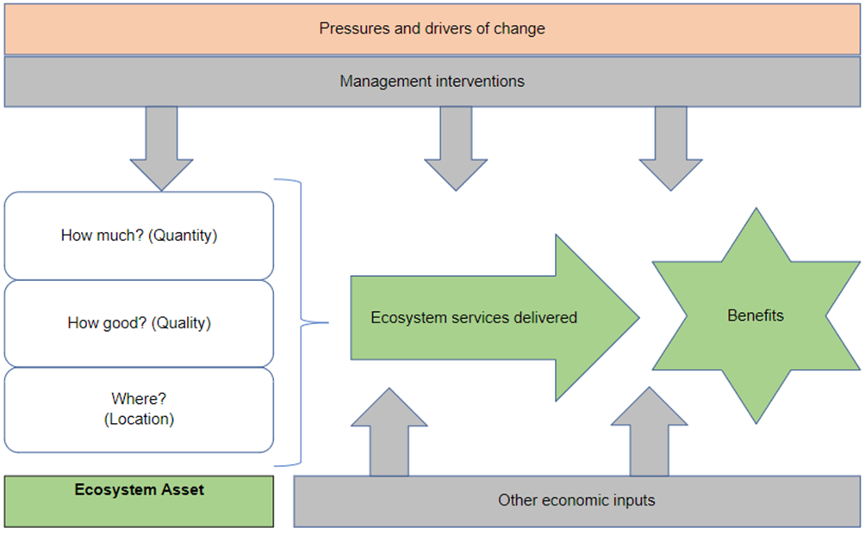
Certain services require additional inputs to realize their benefits. However, in other circumstances, the advantage accrues automatically due to the service, without extra cash or human involvement (Figure 14).
Figure 14 The Natural Capital Framework. Source: DEFRA
So far, only a tiny fraction of products offered by nature are considered in current metrics that measure economic progress (GDP) and human well-being (Human Development Index) Dasgupta (2021). Moreover, other benefits, such as pollination, regulation and nature’s ability to mitigate disasters, have failed to be captured. This incapability to account for the total economic values of ecosystems and biodiversity, jointly with the intense pace of economic activity, has significantly influenced their degradation.
Habitat destruction, over-harvesting, climate change, and pollution are among the most significant threats that biodiversity is experiencing, according to IPBES (2019). Above all, these threats are caused by human activity, ignoring the value of nature in financial accounts. Continuing on this path means jeopardizing the present and the future possibility of growth and prosperity. Consequently, reflecting the economic value of ecosystem services in the mainstream public and private decision-making is pivotal to inverting the trend of decline that ecosystems are experiencing and, therefore, positively impacting the possibility of future generations.
3.2.3. Valuing ecosystem services
Putting a value on ecosystem services is the last step in a long and often detailed study of how a policy change will affect them.
Based on the type of ecosystem service and the amount and quality of data that can be used to value it, the valuation method will be chosen. Some forms of valuing ecosystem services may be better at capturing the value of specific ecosystem services than others. Benefits transfer, for example, passes economic values from one place to another with similar features. The use of these kinds of transfers is vital for making more practical policies for the environment.
A framework called Total Economic Value (TEV) is shown in Figure 15. It considers both the use and non-use values that people and society gain or lose from small changes in ecosystem services. Because many ecosystem services are not traded in markets, they do not have a price. So, to figure out how much these goods or services are worth, you need to use non-market valuation methods.
TEV represents the total benefit in well-being from a policy, which is the sum of the people’s willingness to pay (WTP) and their willingness to accept the policy (WTA). We are attempting to capture the overall value of a marginal change in the underlying ecosystem services (DEFRA, 2007).
Figure 15 The Total Economic Value Framework. Source: Millenium Assessment
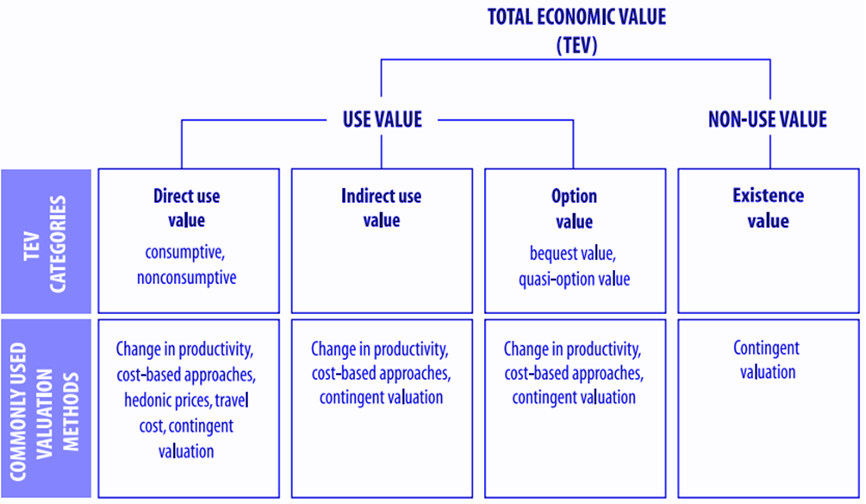
Use value includes direct use, indirect use and option value.
Direct use value is when people use an ecosystem service in the real world or plan to use it shortly. Non-consumptive use and consumptive use are two ways to think about this. Non-consumptive use is when you use the service without taking anything from the ecosystem. For example, you could use the service without taking food or wood from the ecosystem (e.g. recreation, landscape amenity). If there is a formal market for these activities, they can be traded. If there isn’t, they can’t be traded at all (e.g. recreation or the inspiration people find indirectly experiencing nature).
Indirect use-value is when people benefit from ecosystem services that are supported by a resource, but they don’t use it directly. When these ecosystem services are damaged or lost, people ignore them until they’re gone. They’re still significant, however. These services are essential to life on Earth, like regulating the chemical composition of the atmosphere and oceans, climate regulation, water regulation, pollution filtering, soil retention and provision, nutrient cycling, waste decomposition, and pollination. These services are also crucial to life on Earth. It is much more challenging to figure out indirect use values in many cases than to figure out direct use-values. Changes in the quality or quantity of a service are often hard to measure or understand.
The option value is how important it is for people to be able to use a resource in the future, even if they aren’t using it now. These future uses could be direct or indirect, but it doesn’t matter. For example, there might be a national park where people who don’t want to go there but want to keep the option open in the future might still be willing to pay a fee. Option value refers to how important it is to preserve ecosystems and the species and habitats for possible future uses, some of which may not have been thought of yet. A wide variety of species in a habitat can also be considered a form of insurance. As conditions change, different species may play critical ecological roles. Bequest value refers to the value that individuals give because the ecosystem resource will be passed on to future generations.
Non-use value, also known as passive use, comes from knowing that the natural environment is being looked after. Even though an individual doesn’t use or plan to use an ecosystem resource, it has value because it is there. For example, it doesn’t matter if people know that they won’t ever get to see a whale. They’ll still donate money to help keep whales safe. Non-use value is hard to get because people have difficulty putting a price on things because they aren’t often asked to do so. Even in some cases, nonuse value may be more critical than use-value, and this is why.
3.2.4. Valuation Methodology
Below, a 2-stage approach for the valuation of Ecosystem Services is suggested (Figure 16). The aim of this is twofold. First, to derive the economic value of ecosystems relevant to the EU countries. Second, the unit value of ecosystems will be subsequently integrated with the SDG index to measure the social-economic value from moving to ecosystems’ status quo to the full achievement of SDGs.
Figure 16 A 2-stage approach for the Valuation of Ecosystems
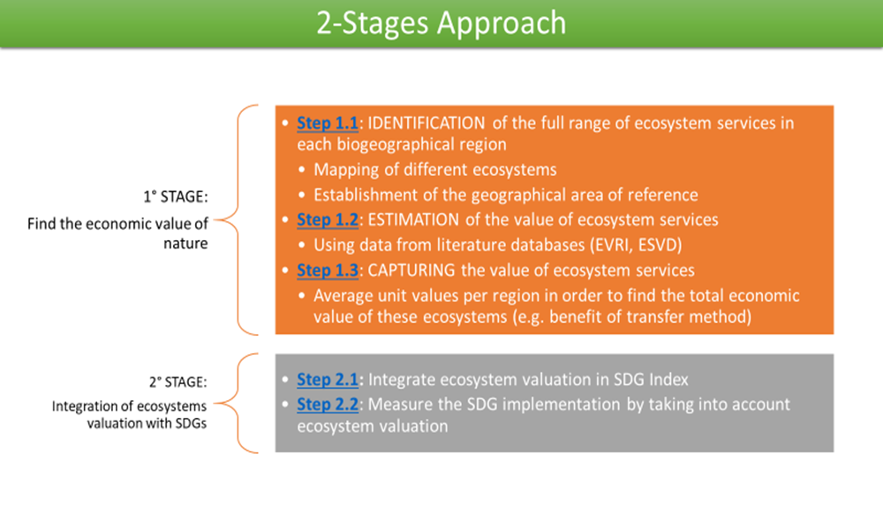
1st STAGE: Valuation of the Ecosystem Services in different biogeographical regions
Data Collection
As for the economic valuation purpose, a meta-regression analysis has been conducted using the publicly accessible database EVRI (Environmental Valuation Reference Inventory). Primary literature related to ecosystem services valuation from 2012 to 2022 has been selected. Studies have been determined according to the ecosystem typology, the ecosystem services valued, and the geographical area in which the study was conducted.
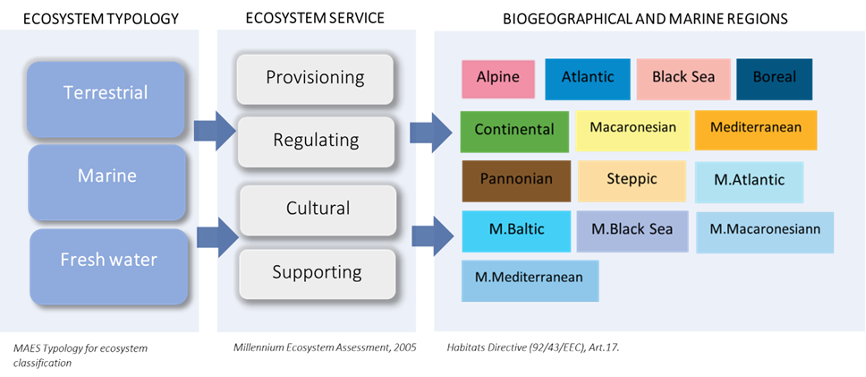
Mapping and Assessment of Ecosystems and their Services (MAES) Typology for ecosystem classification (European ecosystem assessment-concept, data and implementation, EEA Technical Report, no 6/2015) has been followed to identify the typology of ecosystems. This includes three main groups 1) Terrestrial ecosystems: urban, cropland, grassland, forest, heathland and shrub, sparsed vegetated land, and inland wetlands; 2) Marine ecosystems: marine inlets and transitional water, coastal, shelf and open oceans; 3) Freshwater ecosystems: rivers and lakes (Figure 17).
On the other hand, ecosystem services have been distinguished between provisioning, regulating, cultural and supporting services in compliance with the aforementioned MA classification. Finally, since ecosystem typologies vary across regions, the geographical area of the study has been defined according to Habitats Directive (92/43/EEC) and for the EMERALD Network set up under the Convention on the Conservation of European Wildlife and Natural Habitats (Bern Convention). This last distinguishes 9 EU biogeographical regions, i.e. Alpine, Atlantic, Black Sea, Boreal, Continental, Macaronesian, Mediterranean, Pannonian and Steppic and 5 EU marine regions, i.e. Marine Atlantic, Marine Baltic, Marine Black Sea, Marine Macaronesian and Marine Mediterranean.
Figure 17 Mapping of Ecosystems Typology to Services across Biogeographical regions
Estimation methodology: Meta-regression analysis function transfer
To summarize and synthesize the empirical findings of various studies, in our research, we rely on the meta-regression analysis function transfer using the summary statistics provided. Our purpose is to statistically explain the variation found in the studies under consideration due to identifiable characteristics among the considered studies like the valuation method, geographic location, study-specific factors, survey mode, and other relevant determinants and demographic elements.
The meta-analysis model is presented as
$(Y_{i} = \gamma + \beta’X_{i} + \varepsilon_{i})$ (1)
where $({i})$ corresponds to each observation gathered from the studies under consideration, $(Y)$ the dependent variable in our case, Willingness To Pay (WTP), $(\gamma)$ the intercept (if necessary), and $(\beta)$ parameters to be estimated as slopes of the specifications, $(X)$ the matrix of the explanatory variables; $(\varepsilon)$ is the error term with the usual properties.
Specifically,
- Willingness to pay: This continuous variable expresses the annual mean willingness to pay (in euros) for ecosystem services. In cases in which the value of the willingness to pay was expressed in a currency other than the euro, the current year’s exchange rate in which the study was developed was applied. In some studies in which the willingness to accept was calculated, values have been translated into a willingness to pay by assuming that willingness to pay equalizes willingness to accept. Similarly, in other studies, consumers’ surplus values have been considered equal to the willingness to pay. In the estimation, the willingness to pay variable will be considered as the dependent variable;
Various explanatory variables were considered to explain the variation mentioned above. Namely:
-
Ecosystem: is a categorical variable reporting the ecosystems’ typology valued, which follows the categorization provided by MAES, i.e. Forest (42 studies), Cropland (18), Heathland and Shrub (1), Sparsed Vegetated Land(1), Inland Wetlands(3), Rivers and Lakes (14), Urban (15), Grassland (6), Marine (65). The ecosystem variable has been subsequently divided into three different dummy variables: Terrestrial (assuming value 1 if Ecosystem was equal to Forest, Cropland, Heathland and Shrub, Sparsed vegetated land, Urban, Grassland, and Inland and Wetlands and equal to 0 otherwise), Freshwater (assuming value 1 if Ecosystem was similar to Rivers and Lakes and 0 otherwise), and Marine (taking value 1 if Ecosystem was similar to Marine and Coastal, and 0 otherwise);
-
Cultural, Provisioning, Regulating, Supporting: are dummy variables indicating ecosystems’ services, per the MA Reporting categories. They assume a value of 1 if the study provides monetary value for the specific service and a value of 0 otherwise.
-
Survey design: is a categorical variable describing the different data collection methods used by the surveys in each study, i.e. a) Computer-aided individual home interviews, b) Computer-assisted personal interview, c) Dataset, d) Focus group, e)Interviews online, f) Personal Interviews, g) Mail Survey, h) Map layers, i) Questionnaire by phone, l) Questionnaire online, m) Questionnaire in person, n) Questionnaire on-site, o) Workshop. This variable has been subsequently divided into three dummy variables Interview ( assuming a value of 1 when Survey Design was equal to a, b, d, f, m, n, o, and 0 otherwise), Questionnaire online (assuming a value of 1 when survey design is equal to e, g, h, i, l, and zero otherwise) and Secondary data (taking a value of 1 if Survey Design was similar to c, and 0 otherwise
-
Data year: indicates the year of data collection
-
Valuation method: is a categorical variable indicating the method used to develop the analysis, i.e. Contingent valuation, Choice experiment, Actual Expenditure/Market price, Count data model, Hedonic Price Method, Hedonic Property, Meta-analysis, Replacement costs, Travel cost method. In our final dataset, we have 76 Choice Experiment (CE) studies and 67 CVM studies and 22 studies from studies using revealed preferences. We have created three dummies: One for CE (1 for CE and 0 otherwise), one for CVM (1 for CVM and 0 otherwise), and one for Revealed studies (1 for Revealed and 0 otherwise).
-
Location: is a categorical variable reporting the geographical area in which the analysis has been developed;
-
Country: is a categorical variable reporting the European country in which the analysis has been developed;
-
Biogeographical and marine regions of the European Union. Specifically, we have the cases of Alpine, Atlantic, Black Sea, Boreal Continental, Macaronesian, Mediterranean Pannonian, Steppic, Marine Atlantic, Marine Black Sea, Marine Baltic, Marine Maccaronesian, Marine Mediterranean: as dummy variables indicating the specific biogeographical and marine regions of European Union in which the study has been developed, according to with the categorization used in the Habitats Directive (92/43/EEC) and for the EMERALD Network set up under the Convention on the Conservation of European Wildlife and Natural Habitats (Bern Convention);
-
Value elicitation methodology: is a categorical variable indicating the typology of elicitation used in the study
As socioeconomic variables, we have considered the following:
-
Age: is a continuous variable indicating the mean age of the sample population expressed in years. In the studies in which grouped data were provided, the open classes have been assumed to have the same width (in red). Accordingly, the midpoint for each class has been calculated and subsequently multiplied per class frequency. The sum of the results has been finally divided by the total frequencies. As there were many missing values, we considered proxy the mean age for each country and the specific year provided by EUROSTAT.
-
Income: is a continuous variable indicating the mean annual income of the sample population in the euro. In the studies in which grouped data were provided, the open classes have been assumed to have the same width (in red). Accordingly, the midpoint for each class has been calculated and subsequently multiplied per class frequency. The sum of the results has been finally divided by the total frequencies. In the studies in which monthly annual income was provided, the monthly amount was multiplied by twelve months. In cases in which the value of annual income was expressed in a currency other than the euro, the current year’s exchange rate in which the study was developed was applied. For studies in which income data were not available, we used Eurostat data deriving from EU-SILC and ECHP surveys. Eurostat database provides mean equivalized[3] net income by year.
-
Gender: indicates the percentage of males and females in the sample population. It is assumed female =1. This is a variable with 68 missing values, and it has been eventually omitted from our regression analysis. However, for the 97 existing values, descriptive statistics are provided.
-
Education: indicates the percentage of the sample population with a high education level. It is assumed university degree=1. In the case in which educational level data were not available, we resorted to Eurostat data on Population by educational attainment level, sex and age (%), especially we considered tertiary education (level 5-8) according to the International Standard Classification of Education (ISCED 2011)
Concerning our final dataset created using the information of studies collected from the Environmental Valuation Reference Inventory (EVRI), the database has 212, of which 165 were used for estimation[4]. The constructed excel file provides the Study name, which contains information about the studies’ authors, title, journal, and year of publication.
3.2.5. Empirical findings
Willingness to Pay by Ecosystem type and by Country
Relying on the above information, Table 11 provides the descriptive statistics of the variables used in the analysis.
Table 11 Descriptive Statistics of the proposed variables
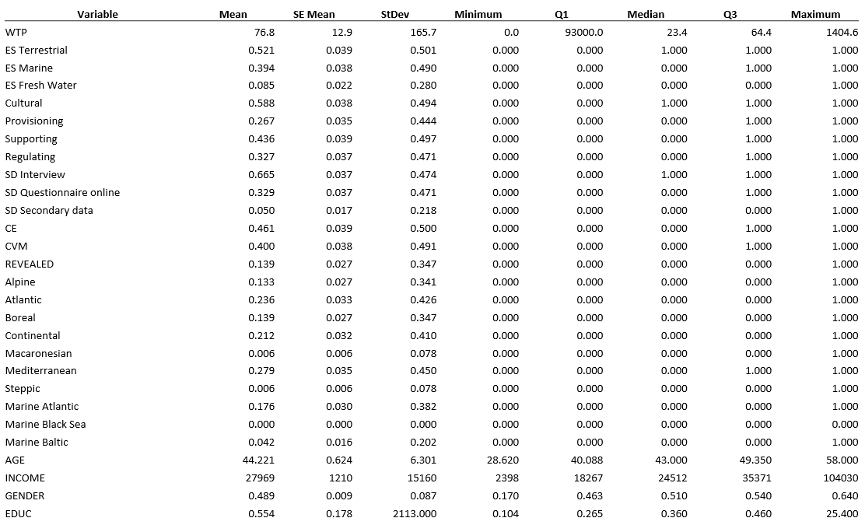
Next, we performed various stepwise specifications of the variables considered slightly elastic in the individual statistical significance of the explanatory variables (using Newey-West heteroskedasticity and autocorrelation Robust standard errors). Apart from the standard levels (of α= 0.01, α=0.05 and α=0.1), we have considered (in such analysis) P-values less than 0.25. BIC criterion was used for the model selection. The 1% extreme WTP observations were excluded from the analysis. Table 12 provides the meta-regression estimates and benefit transfer functions for all the models we considered; that is a model including all ecosystems and its breakdown into Terrestrial and Marine & Freshwater[5]. P values for the Newey West HAC standard errors are reported in brackets.
Table 12 Meta Regression Estimates
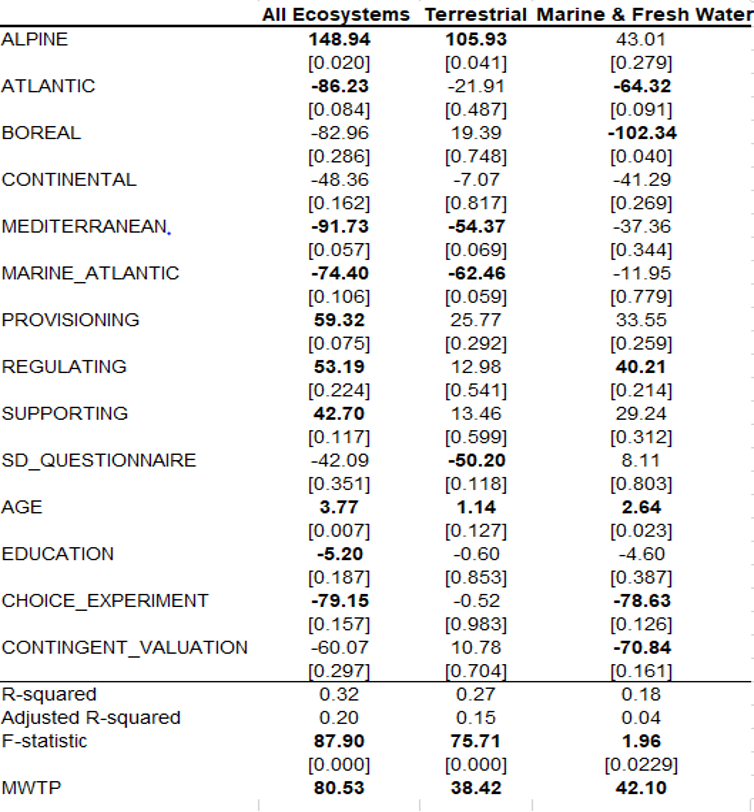
Figure 18 and Figure 19 present the Annual Marginal WTP per household, disaggregated by Ecosystem Service and Bio-Geographical Region for all three ecosystem specifications (Total, Terrestrial and Marine & Fresh water), respectively. Figure 20 provides a map of the European Biogeographical Regions.
Figure 18 Annual Marginal WTP by Ecosystem Service
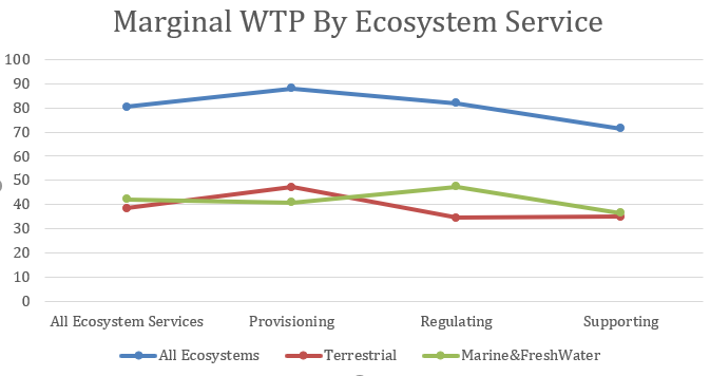
Figure 19 Annual Marginal WTP by Biogeographical Region
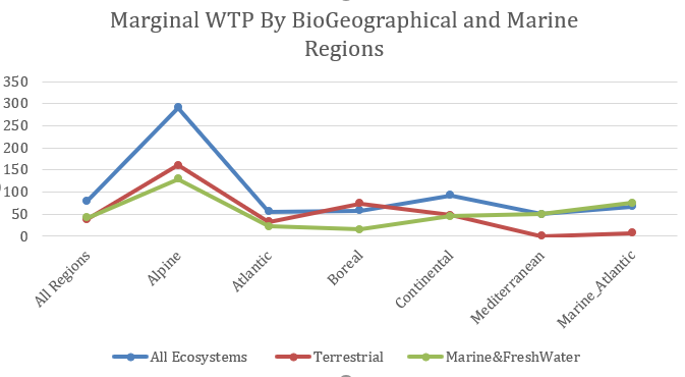
Figure 20 European Bio Geographical Regions. Source: European Environmental Agency
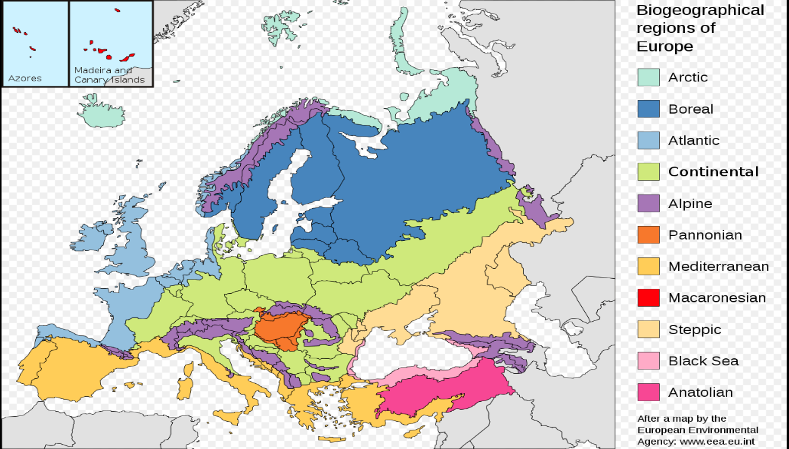
Figure 21 presents the Marginal Willingness to pay at the national level disaggregated in Ecosystems (Terrestrial and Marine & Fresh Water. For the socioeconomic variables of the benefit transfer function (age and education), data for the year 2020 for all countries were collected from Statista (Median age of the world population 2020) and OECD (Share of people with tertiary education in OECD countries 2020). The classification of countries into Bio Geographical Regions follows the definitions by the European Environmental Agency. For all countries that mainly refer to a region not included in our model[6], we normalize all the relevant dummy variables to add to 1.
Figure 21 Marginal WTP by Ecosystem and Country
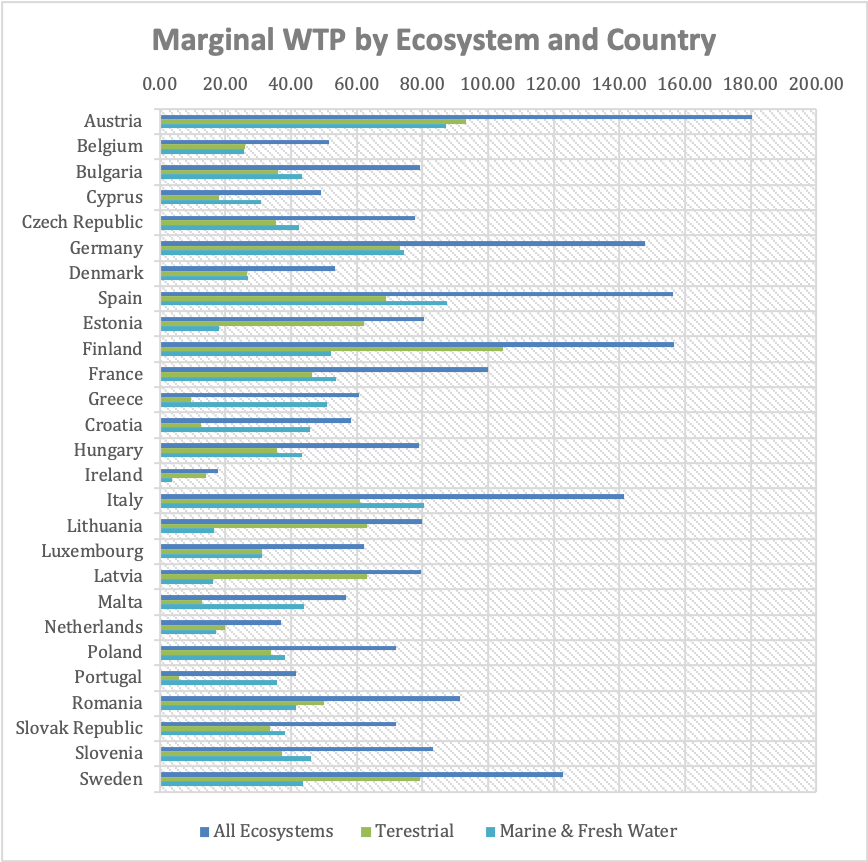
A quick conclusion that can be drawn from observing figure 21 is that in almost 63% of European countries (17 out of 27), the willingness to pay for the improvement of the marine & freshwater ecosystem exceeds that of the terrestrial ecosystems.
The reason why this is happening needs further investigation, which is beyond the scope of this report. However, one possible explanation, may be that the citizens of these countries recognize that marine and aquatic ecosystems are at greater risk of collapse than terrestrial ecosystems, so they are willing to spend part of their income on the restoration or restoration of aquatic ecosystems. Another possible explanation is that the citizens of these countries are dependent on the marine or aquatic ecosystem, e.g. due to fishery production, tourism, etc., to a greater extent than terrestrial, and are willing to bear the cost of maintaining these ecosystems in good condition.
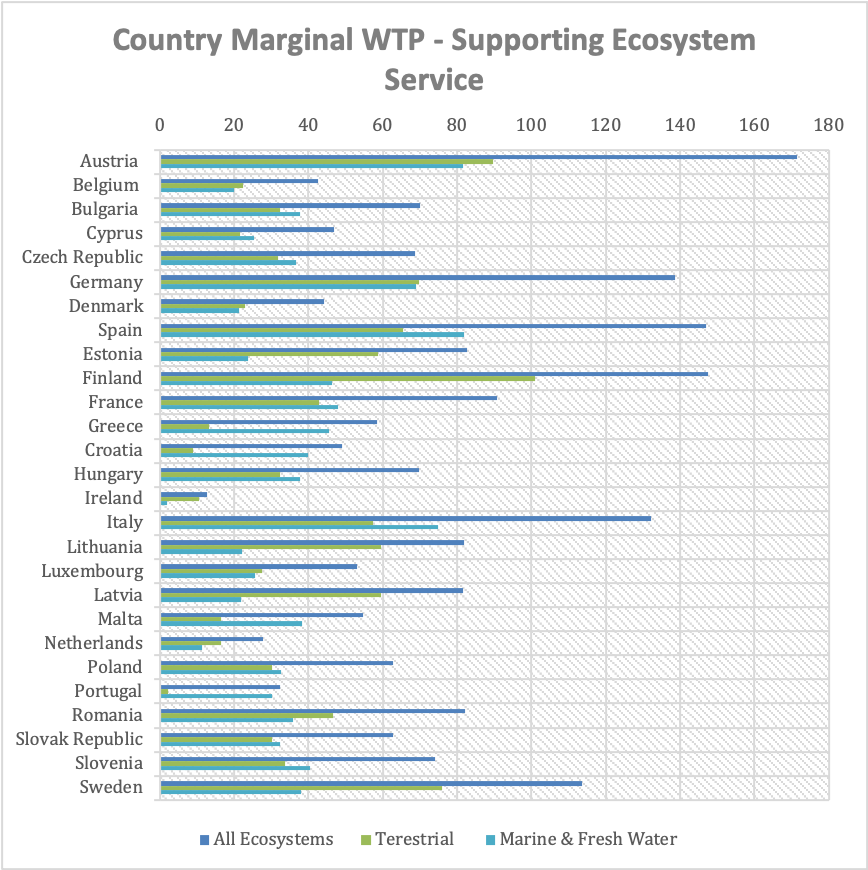
Figure 22, Figure 23, and Figure 24 present the national WTP estimates disaggregated into three ecosystem services (Provisioning, Regulating and Supporting).
Figure 22 Marginal WTP - Provisioning Ecosystem Service by Country
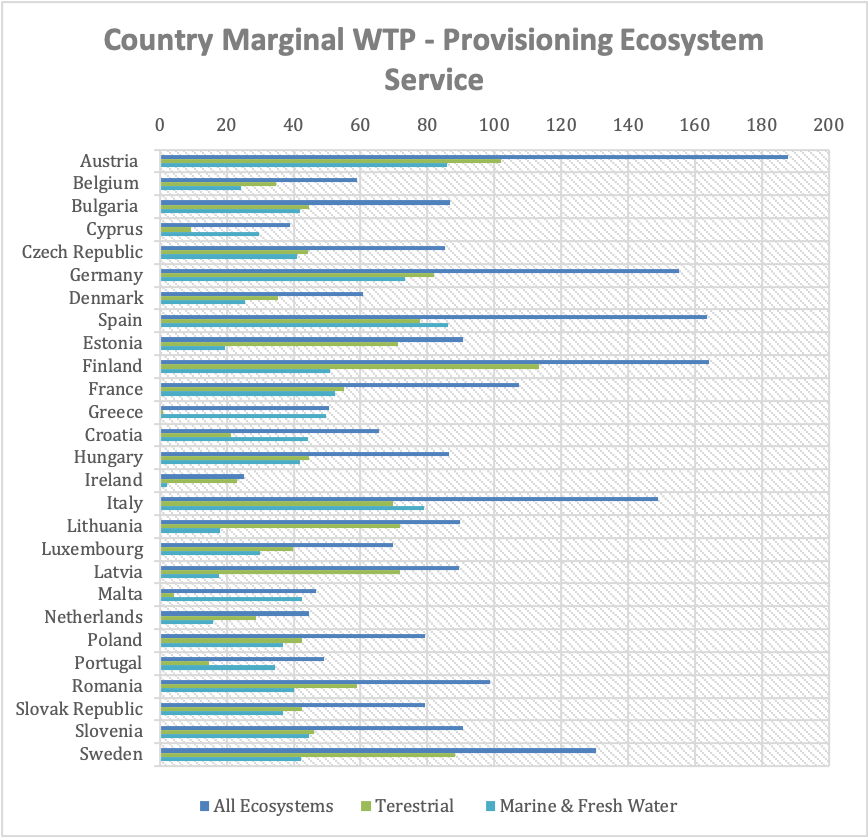
Figure 23 Marginal WTP - Regulating Ecosystem Service by Country
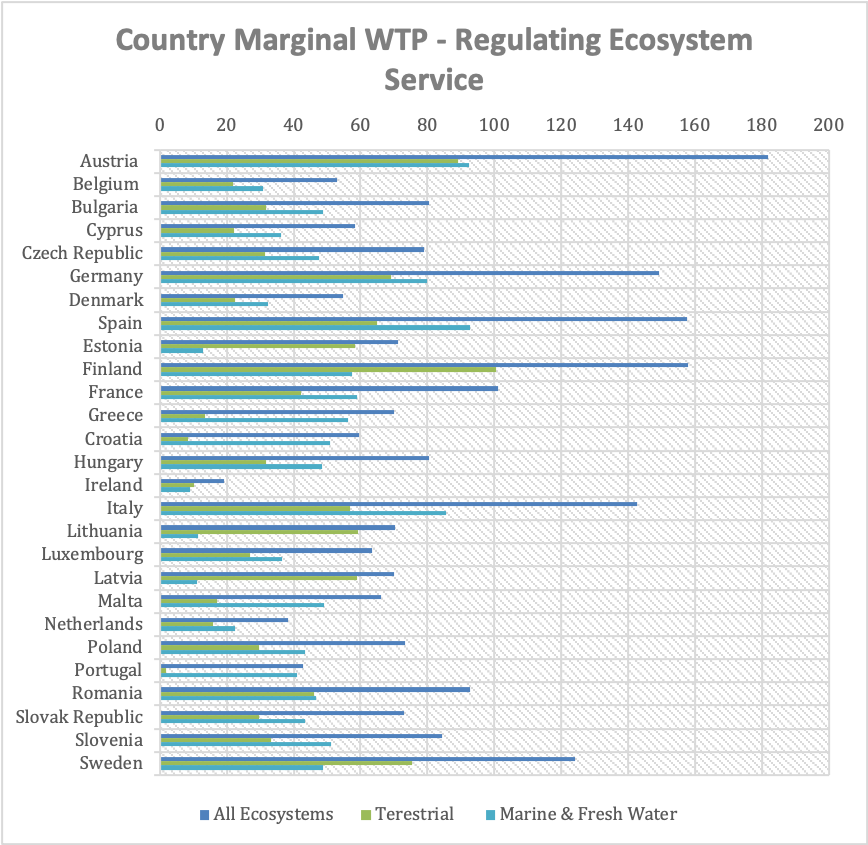
Figure 24 Marginal WTP - Supporting Ecosystem Service by Country
Valuing Ecosystem Services and Sustainable Development
Finding a balance between socioeconomic development and ecosystem services is a crucial challenge for sustainable development (McCartney, 2014).
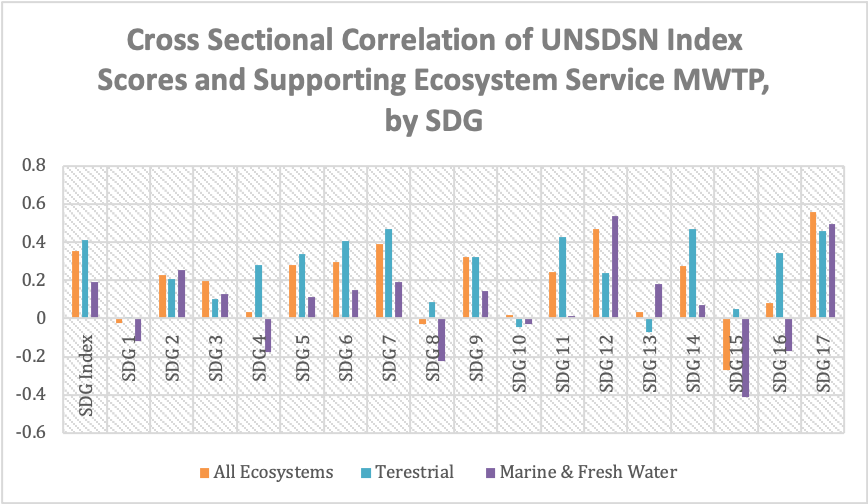
In this subsection we examine the correlation between willingness to pay and the level of achievement of 17 SDGs overall, for the 27 countries of the European Union.
For the calculation of Correlation, we used the scores per SDG of each country from the UNSDSN Sustainable Development Report Europe 2021[7], and the MWTP per country calculated above.
In each of the following figures, the first entry with the label "SDG Index Score" refers to the aggregated Score for all 17 goals, while in the following entries refer to the cross-sectional (27 countries) correlation between WTP estimates and 17 SDG Score (s).
Α positive correlation means that a high level of MWTP is associated with a high level of achievement of a specific SDG. The closer the correlation is to value 1, the stronger the association. Conversely, a negative correlation means that a high (or low) level of MWTP is associated with a low (or high) level of achievement of a specific SDG. Again, the closer the correlation is to the value -1, the stronger the (negative) association.
Figure 25, Figure 26, Figure 27, and Figure 28 present the cross-sectional correlation coefficients between national MWTP estimates and SDG Index Scores and the Scores for all the 17 Underlying goals for all ecosystems and the three ecosystem services categories, respectively. Data for the SDG Scores were obtained from SDSN. Analysis was also performed using rank correlations with similar results, available upon request to the authors.
Figure 25 Cross Sectional Correlation of UNSDSN Index Scores and Ecosystem MWTP, by SDG
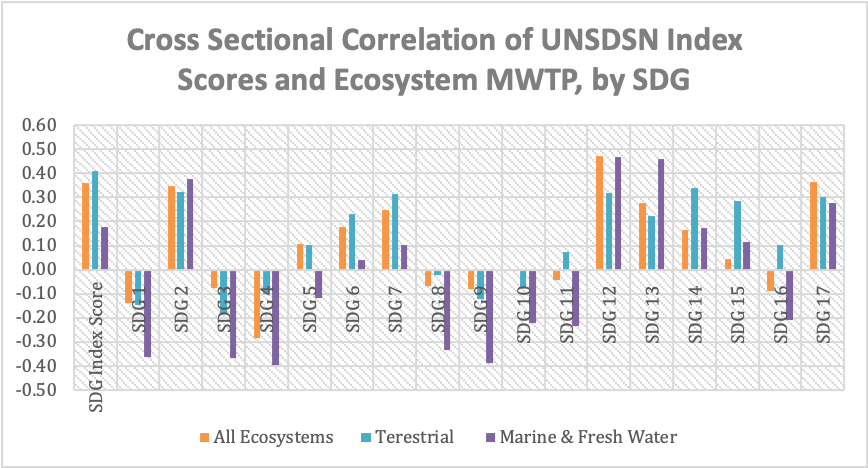
Figure 26 Cross-Sectional Correlation of UNSDSN Index Scores and Provisioning Ecosystem Service MWTP, by SDG
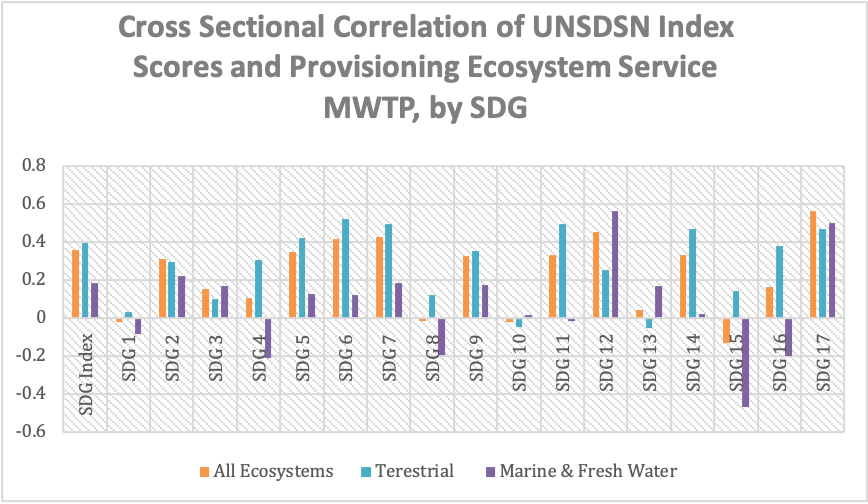
Figure 27 Cross-Sectional Correlation of UNSDSN Index Scores and Regulating Ecosystem Service MWTP, by SDG
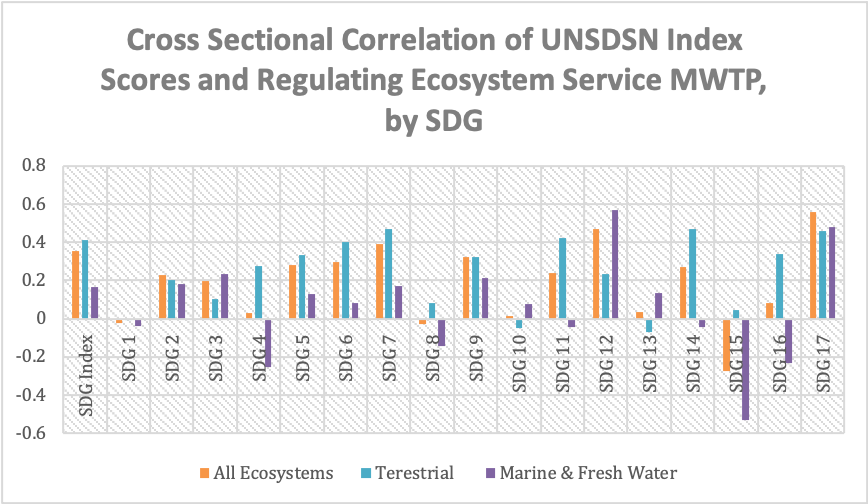
Figure 28 Cross-Sectional Correlation of UNSDSN Index Scores and Supporting Ecosystem Service MWTP, by SDG
3.3. Private and public progress toward ecological transition: policy issues and best practices
3.3.1. “Progressonomy” instead of “taxonomy”: A simple dynamic policy approach to address ecological transition
Metrics for DNSH (a “progress-onomy more than a taxonomy”)
The global public’s bad about global warming is one of the main worries of humankind for the coming years and decades. Global warming is caused by the emission of carbon dioxide (CO2) and other greenhouse gases such as methane and nitrous oxide into the atmosphere. The atmospheric concentration of CO2 and other greenhouse gases grows, mainly due to emissions associated with anthropic activities. At the current level of emissions, the greenhouse effects pose the severe threat of increasing the temperature above the 1.5°C and 2°C degrees targets set in the Paris Agreement.[8]
To tackle this challenge, the European Union has set the ambitious goal of net zero emissions by 2050 from the around 4 billion tons of CO2 equivalents emitted per year.[9] This goal requires a dramatic change in consumption and production styles in five main fields: energy production and transmission, agriculture, manufacturing (especially in hard-to-abate sectors), house cooling and heating, and mobility. The carbon abatement marginal cost curve tells us that the path toward net-zero emissions is flat for its first half, with transition costs that are feasible for the industry. After this first half, however, prices of transition rise steeply, and the path becomes hardly affordable, even though the carbon abatement marginal cost curve moves to the correct year by year due to the fruits of environmentally friendly technological progress.
To successfully tackle the net-zero emission challenge, we need to innovate and profoundly change existing economies and related production and consumption patterns. However, as is well known in the literature, most mitigation in CO2 equivalent emissions occurs not by adapting the existing productive capital stock but by replacing it with more energy-efficient means of production through new investment. This is why we propose in this section an approach for creating corporate incentives consistent with ecological transition and proportional to the mitigation effect of new investments. More specifically, we suggest providing public funds (either in the forms of guarantees or subsidized loans) to new investments in proportion to their capacity to reduce carbon dioxide emissions.
We devise a practical approach to activate the guarantee or the subsidy based on minimum admissible thresholds of progress in CO2 abatement and adherence to the “Do Not Substantially Harm” (DNSH) principle introduced with the EU Taxonomy[10]. Once principles have been identified, the next step is to define metrics and indicators applicable to the purpose (Becchetti et al. 2022).
More specifically, we set two criteria for investment eligibility to the guarantee/subsidy compared to the counterfactual (i.e., the business as a usual scenario without the investment):
-
The investment must improve climate change mitigation (reduction of greenhouse gas emissions) above a minimum per cent threshold consistent with reaching net-zero emissions by 2050.
-
The investment must produce a “green Pareto improvement” fulfilling the DNSH principle, i.e., without worsening other environmental areas.
The definition of fit-for-purpose metrics and indicators is crucial for successfully implementing this approach.
To support new investment decisions, environmental, social, and governance (ESG) criteria set the most relevant DNSH domains for sustainable finance (Migliorelli, 2021). As pointed out by several studies (Yilan G., Cordella M., Morone P.), reliable metrics and guidelines are needed to provide credible information about companies’ sustainability claims by addressing environmental topics and activities related to sustainable finance. Several metrics and KPIs exist and enable an assessment and monitoring of investments (Parmenter D., 2015).
A landmark at the European level is represented by the recent EU Taxonomy Regulation (later referred to as “Taxonomy”), which aims at defining the minimum criteria that economic activities should comply with to be considered environmentally sustainable, with the ultimate goal of facilitating sustainable investments among financial market participants and improving the non-financial disclosure. Criteria of the Taxonomy address six objectives: (1) Climate change mitigation; (2) Climate change adaptation; (3) Sustainable use and protection of water and marine resources; (4) Transition to a circular economy; (5) Pollution prevention and control; (6) Protection and restoration of biodiversity and ecosystems.
For those objectives, the Taxonomy establishes that an environmentally sustainable economic activity must contribute to the substantial improvement of at least one environmental goal and DNSH the other purposes. However, defining all possible investment types for the six DNSH domains and finding agreement among the EU Member States on the proposed taxonomy can require a long time and compromises. Furthermore, there is a risk that a taxonomy becomes obsolete when it is eventually completed since technological innovation has created new investment types not covered by the taxonomy itself.
To keep our approach practical and impact-oriented, we do not refer to a full-fledged taxonomy defining specific requirements for each admissible investment type. Instead, we build upon and complement the Taxonomy by offering an approach which is:
-
Consistent with the ecological transition goal of reaching net-zero emissions by 2050 – essentially a dynamic goal expressed in terms of the rate of change.
-
Based on the assessment of rates of changes in the six DNSH domains of the Taxonomy, where we define key performance indicators (KPI) to evaluate the potential effects produced by the investment.
The approach (see Table 13) consists of the identification and quantification of a set of enhanced KPIs, defined referring to life cycle assessment (LCA), which can allow companies, as well as policymakers, to assess the environmental sustainability performance of new investments from a system-thinking perspective, i.e., considering all upstream activities necessary to materialize an investment (e.g., producing and installing a solar panel in a building) and the post-investment effects (e.g., using and maintaining the solar panel until the end of life management process).
The KPIs, which can be flexibly updated to reflect future methodological and political developments, are designed in a modular way and can be used both by large companies and small and medium enterprises. Indeed, a crucial issue for the successful introduction of such metrics is whether costs of adoption are affordable, especially for small and medium-sized enterprises (SMEs), given that corporate social responsibility (CSR) reporting can quickly transform itself into a competitive barrier for SMEs when fixed costs of reporting are too high. We find that this is the case, as shown by data from Table 14.
Climate change mitigation (Objective 1)
The first KPI measures the improvement of investment in terms of climate change mitigation (Objective 1 of the Taxonomy). This corresponds to the ‘net emission of GHGs’, measured as kg CO2, eq. and characterized based on their Global Warming Potential over 100 years (Zampori L. and Pant R., 2019, EU Commission, 2021). Additional KPIs are set to fulfil the DNSH principle, mirroring the objectives of the Taxonomy (see below).
Climate change adaptation (Objective 2)
Climate change adaptation entails complex modelling and assessment of climate scenarios and associated risks on ecological, social and economic systems (GIZ, 2014, ISO14080:2018, ISO14090:2019, ISO14091:2021). A simplified qualitative indicator is proposed for this area that takes vulnerability and adaptive capacity factors into account.
Sustainable use of water and transition to a circular economy (Objectives 3 and 4)
In a circular economy, wastes are recycled into resources, either through technological or natural ecosystem feedback mechanisms, to preserve the stock of resources (Peña C. et al., 2021).
A variety of circular economy metrics exist (Moraga G. et al., 2019), including both absolute and relative indicators of different levels of complexity, with ISO/TC 323 on ‘Circular Economy’ currently working on the development of harmonized metrics.
Among the most complex indicators, some aim to measure the relative circularity of product systems and organizations Ellen MacArthur Foundation; Razza F. et al., 2020), while others differentiate materials by taking their scarcity into account (e.g. Abiotic Depletion Potential) (Zampori L. and Pant R., 2019).
Considering that the goal of a circular economy is an overall reduction of natural resources consumption and non-recyclable waste generation (Cordella et al., 2020), four KPIs addressing specific elements of circularity are considered (separately):
- Depletion of fossil fuels [MJ]
- Depletion of non-renewable primary materials [kg]
- Production of non-recyclable waste [kg]
- Water footprint – scarcity corrected [m3eq. of water]
Pollution prevention and control (Objective 5)
Pollution prevention and control refers to a broad set of indicators and methods described in the Environmental Footprint (EF) method recommended by the European Commission (Zampori L. and Pant R., 2019). Such indicators address multiple targets (e.g., human health and quality of aquatic and terrestrial ecosystems). A set of KPIs was selected to (separately) consider effects associated with the emission of key pollutants such as particulate matter (PM2.5), non-methane volatile organic compounds (NMVOCs), nitrogen oxides (NOx), sulfur oxides (SOx), and ammonia (NH3). These include:
-
‘Emission of particulate matter (PM)’, measured as disease incidence (UNEP, 2016a) model).
-
‘Photochemical ozone formation’, measured as kg NMVOCeq. (LOTOS-EUROS model).
-
‘Acidification’, measured as mol H+eq. (Accumulated Exceedance model).
-
‘Freshwater eutrophication’, measured as kg Peq. (EUTREND model).
Protection and restoration of biodiversity and ecosystems (Objective 6)
Protection and restoration of biodiversity and ecosystems is an area partly addressed by the indicators presented so far and mainly affected by land-use changes (Marques A. et al., 2019). Land uses different from original natural states (e.g., primary forests) can result in a dramatic loss of biodiversity and ecosystem services (García-Vega D. and Newbold T., 2020). The need for protecting land areas and primary forests is highlighted, among others, in the recent Biodiversity Strategy of the European Commission (European Commission, 2020. COM(2020) 380 final).
Parameters that can reflect these aspects are, for instance, the net area of land (green areas excluded) directly transformed (m2) or used (m2a) for delivering certain functions, including deforestation/afforestation activities. Indirect land-use change is another crucial aspect to consider, where there is, however, an inherent level of uncertainty (Finkbeiner M., 2014).
Biodiversity equivalence factors for different types of land use have also been developed (Huijbregts M. A. J. et al., ReCiPe2016). However, methodological development efforts are required to satisfactorily evaluate impacts on biodiversity (loss/abundance) and ecosystem services in a systematic way (Crenna et al., 2020; Huijbregts et al., 2016; Zampori and Pant, 2019; European Commission, 2021b).
To reflect these aspects, the following parameters are (separately) considered:
-
Direct land use for anthropic activities (m2a), measuring the extension of land directly occupied for anthropic activities related to the investment project (e.g., urban areas, industrial activities) and not covered by green areas.
-
Net deforestation balance (ha), measuring the difference between the area directly deforested to sustain the investment (positive value) and the area reforested or afforested (negative value).
Whenever it comes to evaluating the use of public resources, the issue of additionality comes in. We must wonder whether resources made available for the purpose are well used and not wasted. In our case, the relevant question is whether the private sector would have nonetheless executed the green investment even without the guarantee/subsidy. On this point, evidence on the upward sloping carbon abatement marginal cost curve tells us that costs of ecological transition can be prohibitively high for companies if they are not supported by public investment. In addition, even though investment in environmental change can produce benefits in the long run, short-termism and dependence on management to stay in power from short term outcomes can discourage them from choosing this path of action. The recent theoretical and empirical literature supports the hypothesis that public support creates significant additionality effects in ecological transition. In their “green directed technological change” theory, Acemoglu et al. (2012) show that government support is essential to foster the environmental transition. Countries lagging in it are forced to provide more public resources in the future to reach the right ecologically consistent expansion path. Becchetti et al. (2022) perform an inquiry on the Italian Multiscopo survey on the universe of medium and large firms and a large representative sample of small firms accounting for 84.4% of the national added value, employ 76.7% of the total workforce and 91.3% of Italian employees. Their research shows with a propensity score matching approach that the introduction of EU and domestic investment subsidies rose to 20 % of the share of companies choosing environmentally friendly investment in 2018.
Table 13 Key Performance Indicators considered in the first version of GIFT. Note: KPIs were defined with reference to a primary environmental objective. Due to the interconnected nature of the environment, KPI can also influence other objectives.
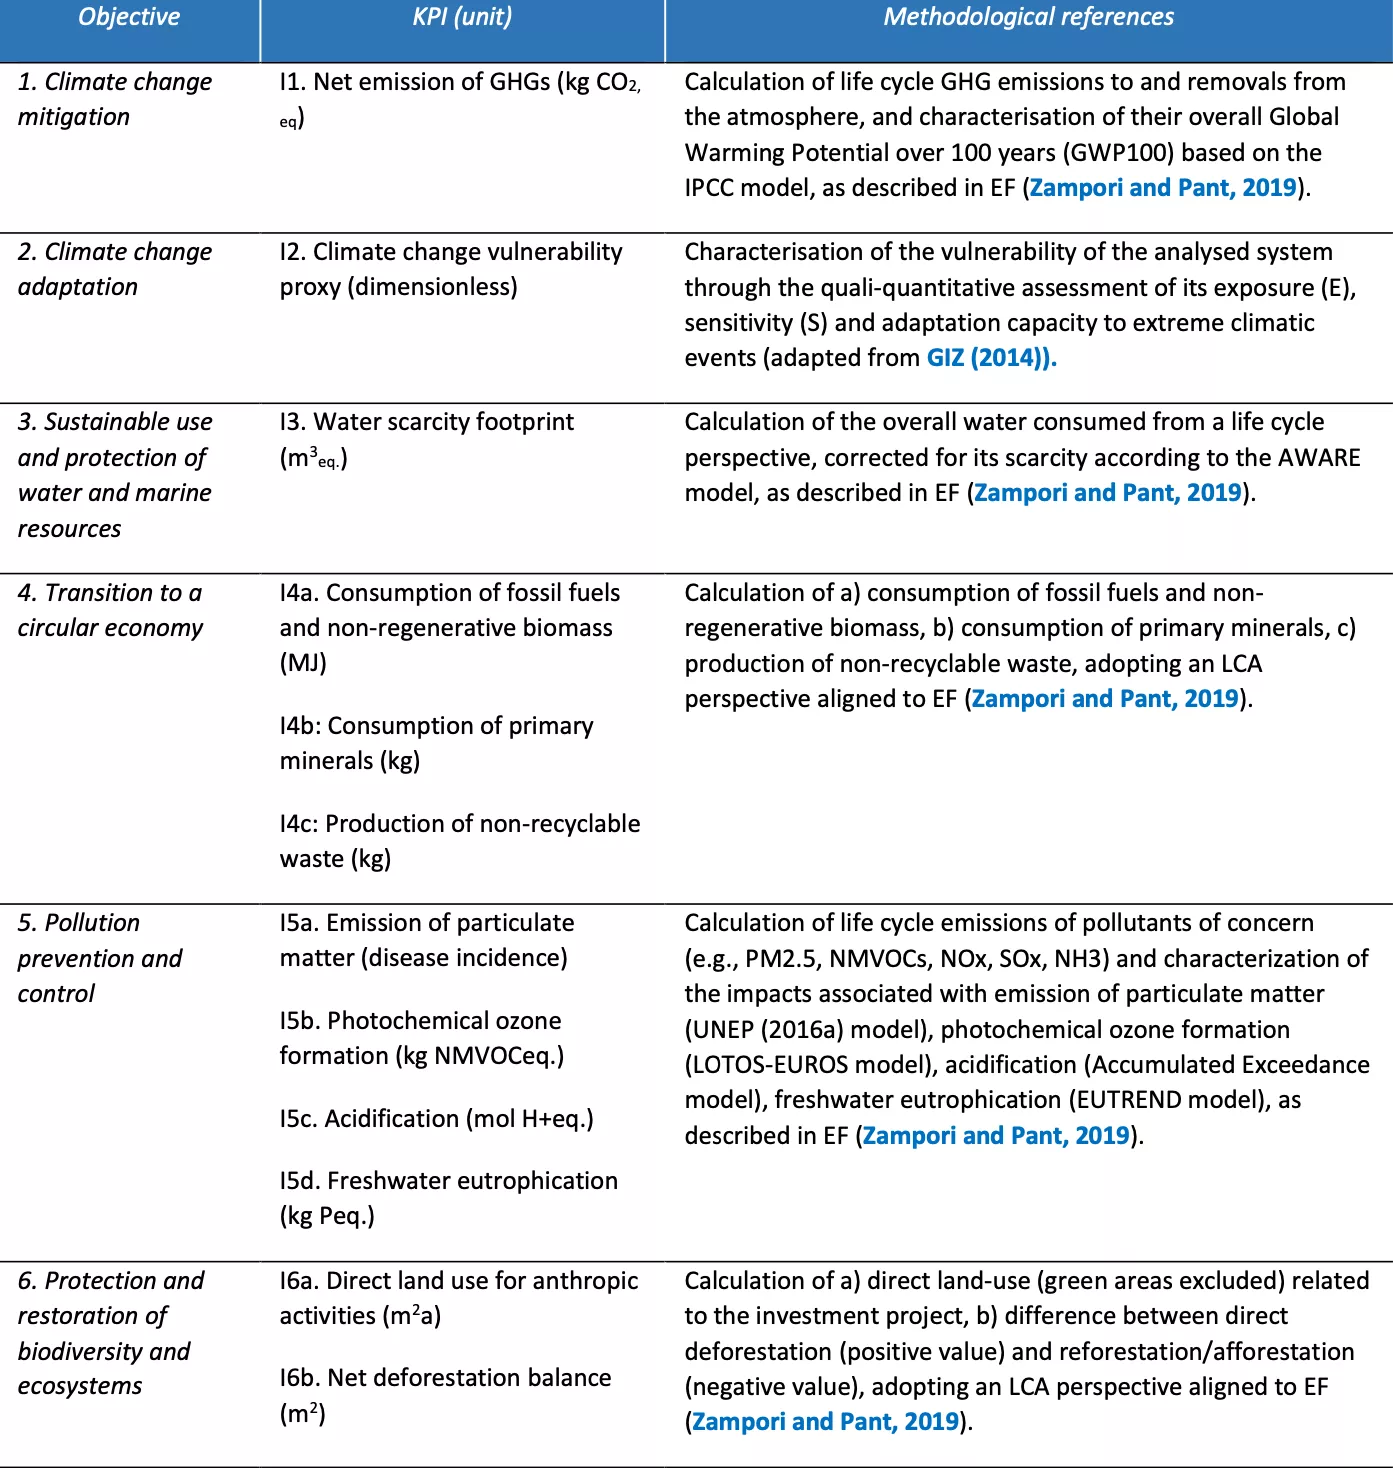
Table 14 Costs in EUR of CSR reporting for different sizes of companies
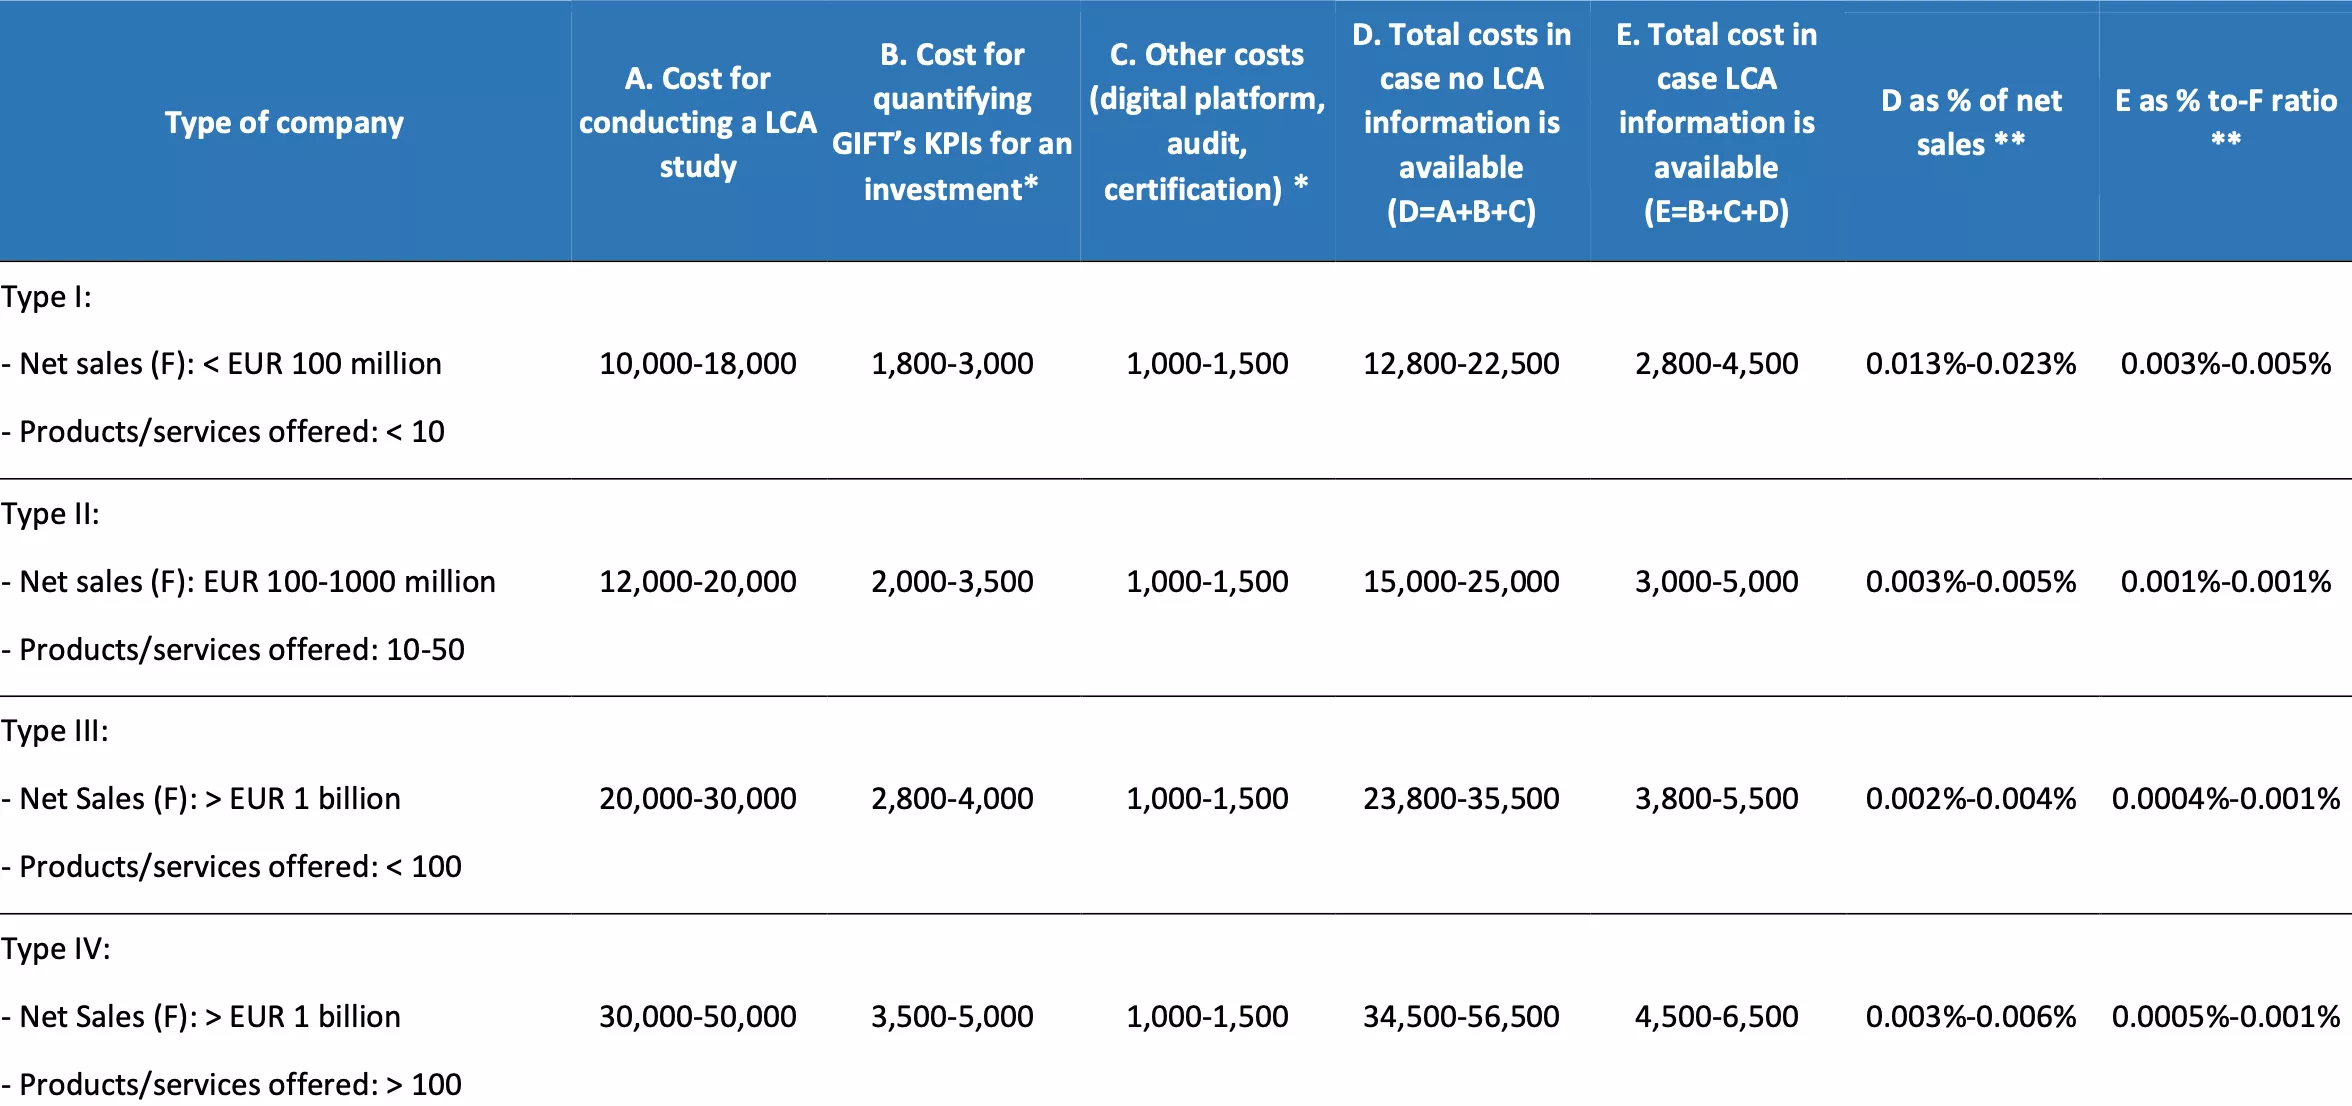
* The cost implies that the ESG evaluator makes at least 100 evaluations per year.
** EUR 100 million for type I, EUR 550 million for type II, EUR 1 billion for types II and III.
3.3.2. The removal of environmentally harmful subsidies: issues at stake
For a long time, world countries discussed the removal of “Environmentally Harmful Subsidies” (from now on, EHS), which are grants or tax reductions that benefit consumers and producers by increasing their incomes or reducing production costs but have an overall negative effect on the environment (OECD, 2005). Despite this, their removal would have a significant positive impact on government budgets, on the level of greenhouse gas emissions and pollution and the overall welfare of the society – leading to a more efficient resource allocation and sustainable growth – progress in this direction has been slow, and subsidies are still an issue in most countries.
The current Covid-19 economic crisis provides a unique opportunity to put new momentum behind this agenda, considering the increase in fiscal expenditures, the problem required, and the need for fiscal consolidation and budgetary discipline in the coming years. Therefore, removing EHS will be an essential source of revenues that governments can seriously consider in this historical economic period.
The main reason beyond the slow removal of EHS relies on the high-cost policymakers face when attempting to eliminate them. In addition, their disposal will generate direct adverse effects on target beneficiaries and a high effort is required of policymakers to identify the EHS that can potentially improve social welfare and avoid widespread disapproval, that in some cases can even lead to social riots and political instability, as happened with the Yellow Vests movement in France.
Despite it, there is a long list of countries worldwide attempting to reform EHS, and from their positive experience, there is a lot that can be learned. For example, there has been a slow removal of energy subsidies in Indonesia. In Northern European countries, there has been an implementation of environmental tax reform packages, reducing implicit subsidies. For example, company car taxation schemes have been introduced in Belgium, the Netherlands, and the United Kingdom; in Sweden, such a measure has been accompanied by a tax exemption for biofuel vehicles.
Good practices can be learned from these successful examples, which can help policymakers overcome the many hurdles faced while attempting to remove EHS.
First, introducing such reforms requires a high level of transparency and good quality information. The impact existing subsidies have on the environment, the cost they impose on society, and the beneficial and distributional effect of the proposed reforms have to be communicated clearly to the public to generate civil and political support.
Second, compensatory measures, for example, through cash transfers, can also increase public acceptance of the proposed reform where the money saved through the reform is at least partially transferred to groups that used to benefit from the subsidy. Such practice has been adopted in the Netherlands, where part of the tax revenues from the removal of red diesel subsidies has been transferred to the agricultural sector through green subsidies. However, while such compensation can lower social costs, individual damages and political protests do not affect individuals’ behavior. For example, in the case of the reform of commuter subsidies in the Netherlands, the relatively favorable fiscal treatment of company cars and commuting costs covered by employers lessened the impact of the proposed reform.
Third, compensatory practices can also have a broader scope. Sometimes, the removal of a subsidy can hit a whole industry and linked economic segments. In this case, the policymakers can intervene through measures aiding both employees and self-employed workers in the hit sectors to find other jobs or activities in alternative sectors. For example, this kind of compensation can be applied in the framework of coal mining subsidy phase-out in several countries, pushing the industry composition of the communities toward a greener, sustainable growth path.
Finally, legislation and commitments at an international level are also important. Coordinated action is indeed required to accelerate reforms worldwide by reducing the loss of competitive disadvantage in the short run that may arise from reform efforts that occur at different periods and building civil support for the process from as wide a range of actors as possible.
An example of the Italian case
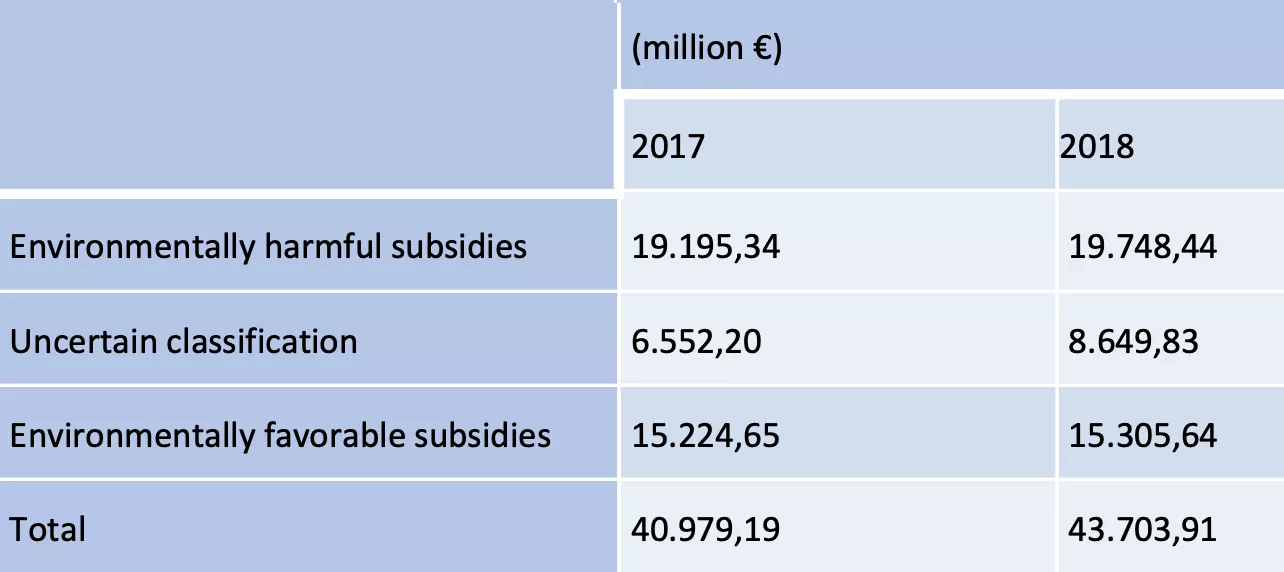
In Italy, the Ministry of the Environment (now Ministry of Ecological Transition) provides a detailed classification of environmentally harmful subsidies (EHS) every year. According to it, environmentally harmful subsidies amount to around 19 billion euros, while 6.5 billion euros are subsidies of uncertain classification and 15 billion euros environmentally favorable subsidies (Table 15). The most relevant item relates to subsidies for diesel on car vehicles, with the latter being taxed less than gasoline car vehicles. The government has created an inter-ministerial commission to examine all EHS and identify those whose removal was considered politically feasible. The excluded EHS have been those related to truck drivers and agricultural activities. In the end, the commission identified a subset of EHS that could be eliminated. The most important of them is diesel car vehicles. The proposal was a ten-year progressive upward adjustment of taxation up to the level of that of gasoline car vehicles. The evaluation of the impact of such measures (based on the average yearly diesel consumption of car owners) has been no more than a few hundred euros per year. In addition, the commission has evaluated a proposal for full reimbursement of such costs by creating a green voucher for the corresponding amount that diesel car owners could use to purchase environmentally sustainable goods and services. The proposal has been regarded as technically feasible given the domestic experience of cashback on credit cards already in operation.
From a theoretical point of view, the approach would have been based on a Slutsky decomposition between income and substitution effect. As is well known, according to Slutsky, any change in the price of a given good can be decomposed into a substitution effect (a difference in the relative cost of that goods concerning any other interest or to the average price level of a bundle of goods) and an income effect (based on the ex-ante bundle of goods purchased by a given consumer the increase in the price of already consumed goods has a negative income effect while a reduction of the price a positive income effect. The rationale is that there is not enough income to purchase the previous consumption bundle after the price change in the first case; there is additional income in the second case.
The proposal of total compensation with the green voucher would eliminate (fully compensate) the negative income effect of diesel price increase on diesel car owners while leaving the substitution effect unchanged. The result would be that the incentive to reduce consumption of the less environmentally friendly energy source given by the substitution effect (change in relative price) would remain. In contrast, the negative social impact of the policy would have been eliminated with the neutralization of the income effect.
Table 15 Characterization of environment-related subsidies in Italy
An alternative OECD perspective
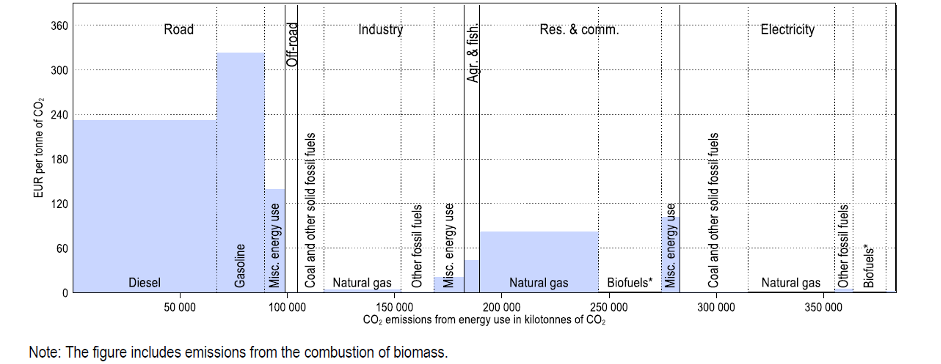
The suggestion of OECD takes a different way. It starts from the principle of “taxing bad and not goods”, which translates into the idea of shifting taxation from labor to pollution. In Italy, there is no direct carbon tax but a system of green and white certificates so that companies have to pay to pollute, and certificates can be exchanged on the market. The OECD calculates the implicit carbon tax paid by households and firms based on the ratio between taxation and polluting emissions. What comes out is that families pay a high implicit carbon tax due to the stratification of following steps of tax increases on gasoline and diesel to increase revenues for the government budget without specific reference to pollution (Figure 29). As a result, the choice of levelling diesel and gasoline taxes does not address the issue of designing the proper incentives for the corporate system and does not consider that taxation on the household is already very high. Therefore, the OECD proposal creates a carbon tax for corporations (i.e. from a base of 60 euros per ton of CO2) that is progressively raised by 10 euros per year. However, the aggregate revenues should be used to reduce the tax wedge on labor. The suggestion closely follows the policy adopted in Germany in the last decade. As is always the case, any policy decision must consider political and social reactions. The problem with this policy is that it is budget balanced in aggregate but not for individual companies. If such removal is proportionally spread across all firms, companies in hard-to-abate industries will presumably have a higher tax take offset by a less than proportional tax reduction on labor. The solutions can be two. The first is that of netting out at the industry or firm-level the difference between a higher tax on pollution and a lower tax on labor. The second is adding to this choice a premium for companies in hard-to-abate sectors.
The idea is to introduce Contracts for Carbon Differences in these sectors. CCDs work as follows: the government commits to a premium of 150 euros for any tons of CO2 avoided. The premium is divided between the avoided carbon tax and a government payment in cash. For example, if the carbon tax level is 80 euros, the government adds 70 euros to achieve the 150 euro premium fixed in advance. The CCDs approach can reward actual outcomes in terms of ecological transition instead of expected results, as in the case of the incentives to DNSH consistent investment explained above. A second advantage is that there is an implicit incentive for an increase in the carbon tax to reduce the government outlay.
Figure 29 Effective energy tax rates in Italy in 2018 across sectors. Source: OECD (2021)
3.3.3. Best practices in an ecological transition
Co-written with Laura Berry, Adriana Kokornik-Mina and Martin Rohner
The dramatic challenges of ecological transition urgently require a mix of policy instruments and financial markets that promote sustainable production and consumption patterns. The transition can be successful if fostered by a blend of proper regulatory changes, environmentally friendly incentives and voluntary choices of financial intermediaries. The rationality of forward-looking economic actors can in itself be a strong, even not sufficient, stimulus to this change since the inheritance of rules moving in the opposite direction (such as environmentally harmful subsidies) and the hysteresis and costs of changing production processes of important actors of the market can slow down the transition.
To contribute positively to this process, we propose the first draft of examples of green finance best practices that can inspire and stimulate further fostering of ecological transition.
Dissemination of best practices has a fundamental inspiring role, and it seeds hope. It is easier to say “yes, we can” if we come to know that someone has already done it somewhere. Of course, the best practice in a given country of the world does not guarantee that the same experience can be exactly replicated in another geographical area, given the heterogeneity in local conditions and concurring factors. Nonetheless, the best practice can inspire innovators to start similar experiences adapted to local needs in other parts of the world. The value of best practices in green finance is even higher. In some cases, we deal with processes (i.e. active shareholders for sustainability) that can be replicated. The best practice is a new financial contract or financial package that can be easily standardized and reproduced in other parts of the world and, if needed, modified and adapted to the different local frameworks and conditions.
In what follows, we briefly describe some of the most promising experiences of green finance around the world, try to outline some common characteristics that can be an ingredient of further advancement in the field and draw some policy implications from them. We also indicate guidelines to progress in this work from our first draft by creating a G20 sustainable finance hub where green finance best practices can continue to be exchanged through a codified and defined process.
Global Alliance for Banking on Values (GABV)
The Global Alliance for Banking on Values is a movement of innovative leaders and frontrunners in the banking industry who holistically and intentionally use the money to finance change, having integrity, human dignity and environmental and social impact at the core of their business model. While our members are highly diverse, they have one thing in common: a shared mission to use finance to deliver sustainable development, focusing on helping individuals fulfil their potential and build stronger communities. Our members also understand that financing change is not enough and that a paradigm shift is needed. Thus, they proactively lead the transformation of banking and finance in their respective countries and communities.
The GABV counts 64-member banks with EUR 200 billion combined assets under management, serving over 60 million people worldwide. Research shows that values-based banks are financially more resilient than the Global Systemically Important Financial Institutions (GSIFIs) due to their clear and explicit focus on sustainability and the real economy.
The Partnership for Carbon Accounting Financials (PCAF) is an example of the GABV’s ability to scale up transformation: PCAF has become the world’s leading initiative for financial institutions to measure and disclose greenhouse gas (GHG) emissions of lending and investment portfolios to reduce their climate impact. As a result, 118 banks and asset owners representing over EUR 30 trillion in assets have signed up. The GABV has been instrumental for PCAF in reaching this goal.
Intentionality, ambition, coherence, and accountability are the key ingredients for genuinely sustainable and transformational finance. ESG will not work if the criteria are not sufficiently ambitious. A sustainable and green product offer will not impact if harmful activities continue to be financed. The GABV stands ready to engage with policymakers and regulators based on its global experience in sustainable and values-based finance.
For over 20 years, UmweltBank has been using its customers’ money exclusively to finance environmentally friendly and social projects, mainly in renewable energies and ecological and social housing. UmweltBank is committed to offering only products and doing business that visibly promote the goal of a world worth living in. To guarantee this, UmweltBank has developed far-reaching positive and exclusion criteria. These provide the framework for all activities of the UmweltBank, including credit approvals. UmweltBank is committed to all 17 United Nations Sustainable Development Goals but is focused on its core business to goals 7, 11 and 13. Projects must have a positive SDG influence and must not display significant controversy in one or more social and ecological criteria (exclusion criteria).
In terms of loans for building constructions, every project is reviewed for its economic viability and ecological and social criteria. The rating system is based on a detailed catalogue of criteria that is divided into two categories: on the one hand, construction criteria such as energy efficiency, resource conservation and climate protection, and on the other hand, social aspects such as co-responsibility, integration into the neighborhood and mobility. The credit conditions are based on the premise: The better the environmental rating, the more favorable the loan. The goal is to create affordable, ecological housing and energy-efficient commercial properties.
One example of financed affordable, ecological housing is the project “City quartier Güterbahnhof” in the German city Tübingen. Of the 157 flats, 93 belong to social housing. These are rent-controlled for 25 years and are priced one third below the rent index. They are only available to tenants with a housing entitlement certificate. One-third of the subsidized flats were occupied by unemployed people, another by single parents with children and the last third by student families. The freely financed apartments are also offered at rents below the market level. The construction project meets the social and ecological requirements of UmweltProjekt AG: all flats require only 40 per cent of the energy of a comparable existing building.
UmweltBank pursues the vision of "100 per cent renewable energy" through financing projects in renewable energy. All financed projects support the transition to a carbon-neutral, sustainable economy. UmweltBank’s current most significant investment to date in energy projects, regarding the installed capacity, is the “Solar park Schornhof” near the city of Ingolstadt. It currently is the largest solar park in Bavaria with an installed capacity of 120 MWp, of which 90 MWp are Power Purchase Agreement-backed. The CO2 savings of the project amount to 82,000 tonnes.
Shareholders for change
Public shareholders’ long, influential tradition of activism has been deeply aligned with the global public good for over 50 years. The idea of responsible, sustainable capital and the expectations of forward-looking investors may well have originated with religious investors in the early 1970s.
The history of this activism began in 1971 when institutional investors in North America began to exercise their rights as shareholders in the fight against apartheid in South Africa. At that time, the abhorrent policy of apartheid, the legislated segregation of races in South Africa, became a clarion call to action for faith communities. In 1971, the Episcopal Church in the U.S.A. filed the first justice-inspired shareholder resolution with General Motors, the world’s largest corporation by market capitalization. The longtime institutional investors were newly minted shareholder activists. Their proxy resolution asked the company to withdraw its operations from South Africa until apartheid was abolished. Other faith organizations joined their campaign and organized themselves as the Inter-Faith Committee on Social Responsibility in Investment. Many consider this to be the moment the responsible investment movement was established. The original committee became the Interfaith Center on Corporate Responsibility, now the leading voice in global shareholder activism on topics as far-reaching as climate change and the energy transition, human trafficking and modern-day slavery, healthcare inequality, and pharmaceutical pricing.
Since that time, investors around the globe have experienced the persuasive power of the shareholder’s voice as multinational companies adopt more just and sustainable policies and practices that honour the license to operate afforded them by society at large. Green finance can benefit enormously from the best practices developed by these shareholder coalitions and policies to strengthen the investor’s voice, and engagement will accelerate advancement in the field toward the shared goals of all forward-looking economic actors. In this section, we reinforce the necessity of policy guidance to maintain the unmistakable voice of shareholders to ensure green finance takes hold.
Although the anti-apartheid movement is frequently cited as the progenitor of today’s global movement to divest from fossil fuels, shareholder power has as its core the ownership interest of shareholders. There has been a tremendous value in the impact of divestment movements, particularly in coalition building and delivering a message driven by deeply held moral principles. However, divestment movements are built upon moral choices to “opt out”. The question posed by green finance and forward-looking ethical actors is how to “opt-in” to best practices as participants in public markets. Avoiding “sin stocks” of companies or entire sectors has traditional roots in religious tradition and practice. Avoiding companies engaged in practices contrary to one’s ethical framework is always a choice. Divestment from whole industries that have the potential to cause significant harm, such as the current fossil fuel divestment movement or liquidating positions in companies unwilling to change practices after years of exposure and engagement, is to be celebrated as ethical choices. The future of green finance requires investors to “opt-in” for better options.
There has been a considerable fascination with the increasing efficacy of shareholder engagement. With the expansion of analysis of environmental, social and governance factors, the issues taken on by shareholder activists are expanding. Given the urgency of the global climate crisis, the current COVID19 crisis and increasing worldwide inequality, it is no surprise that the role of investors is subject to closer scrutiny.
In one ethnographic study, Ferraro and Beunza (2018) described their experience observing how ICCR investors voice their concerns to companies whose shares they own. They sought to explain how investor activists influence companies to change business practices and act more responsibly. They took a closer look at “shareholder engagement.”
Rather than confrontational tactics such as boycott and protest, shareholder engagement is an approach in which investors conduct dialogues with corporate management, “engendering mutual respect between shareholders and management.” Over time, this process described as “sensitizing” allowed the investors to reframe issues, articulating the business case for more just and sustainable practices. Both the investors and management were then willing to commit to a long-term relationship where value for the company could be created, one that “breached” the long-standing organizational inertia that has prevented change. These steps, sensitizing, reframing, committing and breaching, have proven so effective that in 2017, an independent regional coalition was launched to meet the needs of European investors.
This three-year-old shareholder coalition, Shareholders for Change (SfC), exemplifies the evolution in shareholder activism, adopting ICCR’s decades-long learning to meet the needs of European investors. The alliance has grown to represent a dozen members and over $25 billion. The story of this nascent coalition may well guide the ways policymakers can support the incorporation of investors’ voices to strengthen green finance and the march toward more sustainable and just economies. When SfC was launched in 2017, it had main objectives: staying administratively light and introducing new issues and strategies to companies, issues other global coalitions had not yet taken on. Acknowledging organizations like PRI and the ICCR worked closely with European investors, neither had the specific goal of engaging European investors with European companies. However, with newly developed platforms for online interaction and data collection, SfC realized an opportunity to connect without creating additional burdensome administrative infrastructure. This approach has proven to be prescient, as global activists have confronted the COVID19 pandemic.
In a recent Engagement Report (2020),[11] President Aurélie Baudhuin of Meeschaert Asset Management (France) writes that the coalition succeeds on both fronts. Driven by original research, SfC has developed engagement strategies on two “orphaned issues”: tax avoidance in the telecommunications sector and the ESG risks linked to the extraction of rare metals. Both issues were at the forefront of challenges faced in the pre-pandemic world, and both have been exacerbated in these challenging times.
The same report highlights the range of issues taken on by SfC members, through individual and collective engagement efforts, including forced labor in supply chains of the European information and communication technology companies, exposure to fossil fuels of destructive bond issues, governance issues throughout a wide variety of global companies, engagements with governments acceding the UN Biological Weapons Convention, to name a few. One could argue that policymakers could predict tomorrow’s emerging economic issues by focusing on the activities of today’s shareholder coalitions. As regulatory frameworks are developed, including a mechanism by which these investor voices are heard would strengthen the likelihood of sound and forward-looking policy.
Despite the challenges posed by the restrictive operating environment, SfC engaged 100 companies and one country on issues related to climate/environment, governance and executive remuneration, human rights/worker rights and tax practices. 80% of the engagements were with companies based in Europe. These engagements occur via three routes; network-driven, single member-led teams or engagement by a single member on behalf of the entire coalition. Each approach requires investors to access information and key indicators to engage and monitor progress. Transparency initiatives and reporting standards are critical to investor efforts’ success; thus, continued attention to rule-making favouring investors’ access to high-quality data and reporting taxonomies is essential for meaningful progress.
Finally, much engagement work depends on how investors can reinforce engagement activities with access to public areas such as a company’s Annual General Meeting (AGM). Although this past year was exceptional, any policies that improve shareholder access to formal governance structures, such as proxy statements and in-person AGMs, are important avenues through which these important issues are brought forth to strengthen companies’ efforts to operate in compliance with ESG best practices.
Private green bonds
On the international scene, BlackRock - the world’s largest investment firm with approximately $8 trillion in assets under management - has recently embarked on a long series of initiatives geared toward sustainable investing. By way of example, BlackRock has integrated and enhanced the measurement of ESG criteria into the investment strategies it offers over the past year.
The firm is also involved in the growth of the green bond market: as of March 31, 2020, BlackRock held more than $16 billion in green bonds. To increasingly promote these instruments, it has developed a proprietary taxonomy that assigns a color to each green bond on a scale from very light green to dark green depending on the intended use of the bond’s proceeds, the associated environmental benefits, and its issuers’ commitment to impact allocation and reporting.
BlackRock is also an active market participant member of the ICMA Executive Committee on Green Bond Principles.
ICMA, which groups lending and investment institutions worldwide, launched working groups on sustainable finance long ago, particularly on green bonds.
The Association has developed the so-called Green Bond Principles (GBP), in addition to the Social Bond Principles (SBP) and Sustainability Bond Guidelines (SBG), a set of voluntary guidelines that were initially developed in 2014 and updated regularly most recently in 2018[12].
The principles are intended for broad market use: they guide issuers on the critical components of launching a credible Green or Social Bond; they help investors by ensuring that the information they need to assess the environmental and social impacts of their green and social bond investments is available, and they assist underwriters by moving the market toward standardized disclosures that facilitate transactions.
In October 2019, the Executive Committee in charge of the Principles established a working group on Climate Transition Finance with a mandate to consider, among other things, what a climate strategy would mean for issuers and how to assess the consistency between the plan and corporate spending. The Committee also established a working group on Sustainability Bonds to examine them in-depth and develop guidance for issuers. According to the definition developed by ICMA, these instruments are intended to finance both environmental and social projects, thus becoming a kind of hybrid between Green and Social Bonds.
As for Italy, a central player is Cassa Depositi e Prestiti (CDP), issuing ESG Bonds since 2017 and has developed the so-called “Green, Social and Sustainability Bond Framework” based on principles developed internationally by ICMA. The proceeds of the bonds issued by CDP are linked to sustainable objectives such as urban development and new essential infrastructure, support for SMEs, social housing and energy transition (CDP, 2020).
Similarly, Intesa San Paolo has launched several experimental initiatives that have led to the issuance of two Green Bonds[13].
The first, issued in June 2017 for 500 million, is related to financing projects dedicated to renewable energy and energy efficiency. According to the 2020 Report, 76 loans were granted, mainly in photovoltaic and wind power projects and hydroelectric and biomass. For instance, in the Province of Ferrara, the construction of a biomethane plant was financed.
Instead, the second Green Bond was issued in late 2019, with a stated focus on the circular economy. Specifically, proceeds are directed towards financing solutions that extend the life cycle of products (12.5%), employ recycled resources in manufacturing (36.9%), improve resource consumption efficiency (32.7%), contribute to the design and manufacture of recyclable or compostable products (5.6%), and support innovative circular economy technologies (12.3%).
Other institutions which undertook experimentation are Etica SGR and Poste Italiane. The former offers ethical investment funds with different risk profiles and is divided into two thematic categories: climate change and ESG. On the other hand, Poste Italiane has adopted responsible investment policies in its Poste Vita and Bancoposta Fondi SGR businesses. The group, therefore, follows ESG and Responsible Investment Principles (PRI).
The “SACE Guarantee” recently introduced by Decree 76/2020 can also be considered an essential element in the attraction of sustainable investments: in fact, the regulation envisages the possibility of issuing State-backed guarantees for circular economy projects, the reduction of emissions and sustainable mobility; a measure of particular importance for small businesses that often lack the necessary liquidity for these investments[14].
Green Minibonds
The largest source of capital for small and medium-sized companies in the banking sector, in its various forms. According to Thomä et al., non-commercial banks are better suited for these companies than commercial banks. Among the main reasons: are a greater propensity for long-term non-bank loans, lower denominations, and a more widespread presence on the territory. Therefore, it is essential to ensure the so-called banking diversity to facilitate access to green finance for SMEs.
As for bond issuance, although there are dedicated platforms, in most cases, they involve larger-than-average SMEs, even exceeding the size of an SME. Bonds indeed can allow medium-sized companies to “scale up” and access even greater capital. To meet the needs of small companies, the so-called Mini Green Bonds could be decisive, along the lines of what has already happened in Italy with the Minibond market (Extra-MOT Pro)[15]. According to the Polytechnic of Milan, although Minibonds have costs that are not always competitive with traditional bank loans, they are a valuable tool to allow SMEs to diversify their sources of funding, acquire new skills and opportunities in the financial market and signal openness and transparency to the market (Osservatorio minibond, 2019).
In a study on sustainable finance, the European Commission has defined the Italian initiative of the Minibond Market as a “best practice” and has indicated Mini Green Bonds as a valuable complement to “standard” Green Bonds to increase access finance for SMEs. However, the Commission warns of the possible risks for investors and points out the need to strengthen the risk management aspects (EU Commission, 2016).
According to the World Bank (2017), national governments should develop guidelines for SME lending, including providing technical assistance in assessing standards (something the Ministry of the Environment is experimenting with). Investors and lenders, in turn, should continue to develop systems for measuring environmental and social risks and impacts. At the same time, companies could implement green policies internally and throughout the value chain (for example, by requiring higher sustainability standards from suppliers).
Government green bonds
According to the last report of the Climate Bond Initiative, the total amount of private and government green bonds totaled an adjusted USD257.7bn in 2019, a 51% increase from the previous year[16].
Government green bonds are purpose-oriented bonds that aim to stimulate environmentally sustainable government expenditure and find the best financing conditions by meeting investors willing to pay for ecological transition. The market for government green bonds is significantly growing and evolving toward high-quality standards. The best practice consists in the preliminary issue of a green bond framework where governments communicate transparently to investors the main characteristics of their future issues. The framework is built together with independent third parties that release a final opinion on it. The dialogue with independent third parties is a stimulus to include in the set of admissible investments only those with high green standards to have a better reaction from green investors and to earn a negative premium for brown bond equivalents (i.e. non-green bonds with the same maturity characteristics). Quality factors of government green bonds include a significant share of financial resources directed to new innovative projects, standard yearly reporting, ex-ante evaluation and ex-post impact analysis of the financed investment.
Central banks and green finance
Other relevant financial actors, such as Central Banks, are coordinating and contributing to the implementation of green finance: the Network of Central Banks and Supervisors for Greening the Financial System (NGFS), created in 2017, is one of the fora where this is happening. More recently, the European Investment Bank (EIB) announced that by 2021 it will stop financing fossil fuel-based projects and that it will mobilize 1 trillion euros in sustainable investments.[17]
The European Central Bank (ECB) announced that by 2021 it would accept green bonds as collateral with payouts linked to sustainability goals and include them in its asset purchase schemes[18]. “Green Quantitative Easing” effects are considered part of the Bank monetary policy decisions for the post-COVID-19 recovery (Ferrari and Nispi Landi, 2020).
We believe that, shortly, Central banks are going and should include green characteristics together with the return, risk and liquidity as leading criteria in their reserve management strategies, thereby giving a further stimulus to green finance
3.3.4. Policy implications for enhancing the development of best practices
A first straightforward policy implication is that the development of non-financial reporting can be a solid stimulus for communication and dissemination of best practices, a set of indicators that can help organizations and companies to monitor their progress in ecological transition, which is nowadays a fundamental part of their competitiveness. However, further reflection is needed to understand whether its development goal should be left to voluntary mechanisms or supported by mandatory rules enforcing non-financial reporting for companies above a given size threshold. An intermediate tool can be a system of incentives that can positively affect reporting decisions.
A fundamental common characteristic of best practices is that they combine the common goal of profit creation with those of social and environmental impact. Therefore, it is essential to reform our legal systems to accommodate the move toward multidimensionality of organizational and corporate goals and to broaden too narrow boundaries that limit corporate action to the interest of shareholders.
The ecological transition will be successful if it changes the behavior of households and companies toward responsible consumption and production (i.e. goal 12 of the UN Sustainable Development Goals). A system of green subsidies or tax allowances can significantly help achieve this goal, as shown by the economic literature on green directed technological change. Green investment involves incorporating new technologies and, therefore, higher informational asymmetries between investors and financiers than under conventional investment. This is why subsidies can have a significant role in reducing higher costs of external finance or financial constraints when investment, as is most often the case, cannot be self-financed. The need for green subsidies can be higher, especially in cases (small firms and firms working in less developed areas) where financial asymmetries and entrepreneurial risks are higher.
3.4. Sustainability of Assets under Management - Financing the Green Recovery
3.4.1. The Urgent Need to Fund the SDGs
The global coronavirus pandemic spotlighted our global interdependencies and interconnectedness, reinforcing the urgency of meeting the United Nations Sustainable Development Goals (SDGs) and representing a potential red line between a carbon past and a cleaner, more empowered future. The coming transition period between these two eras calls for unprecedented responses by states, organizations, and individuals.
The 17 SDGs represent a baseline level of progress that needs to be achieved in the next decade to establish a sound foundation of sustainable development for future generations. However, with less than a decade to go until the 2030 target date, the achievement of the SDGs is today at serious risk. And with the goals being deeply interconnected, the failure to address any one of them hinders progress on others. This interconnectedness also creates systemic risk for the world should the goals be missed, creating a potentially vicious circle of environmental degradation, political upheavals, economic disruptions and conflict, and human security risk, making the need to meet the SDGs an urgent one for the world.
3.4.2. Funding Requirements…and Gaps
Continued underspending, the increasing actual costs of meeting the goals, and the setbacks suffered due to the global coronavirus pandemic are all widening the overall SDG funding gap previously estimated at US$4.2 trillion per annum[19]. However, a more recent bottom-up estimate that included the costs of meeting increasing commitments under the Paris Agreement and the cost of creating financial inclusion and prosperity for large parts of the world found that the actual funding gap was likely twice as high or more.
The actual SDG funding gap is estimated to range from US$8.4 trillion to US$10.1 trillion, equal to 9-11% of the estimated 2021 global GDP[20]. This compares to an estimated current annual spending against the SDGs of US$3.2 to US$4.1 trillion[21], bringing the total yearly cost of achieving the SDGs to US$11.6-14.2 trillion every year through to 2030 (Figure 30).
Figure 30 The Annual Sustainable Development Goal Funding Gap
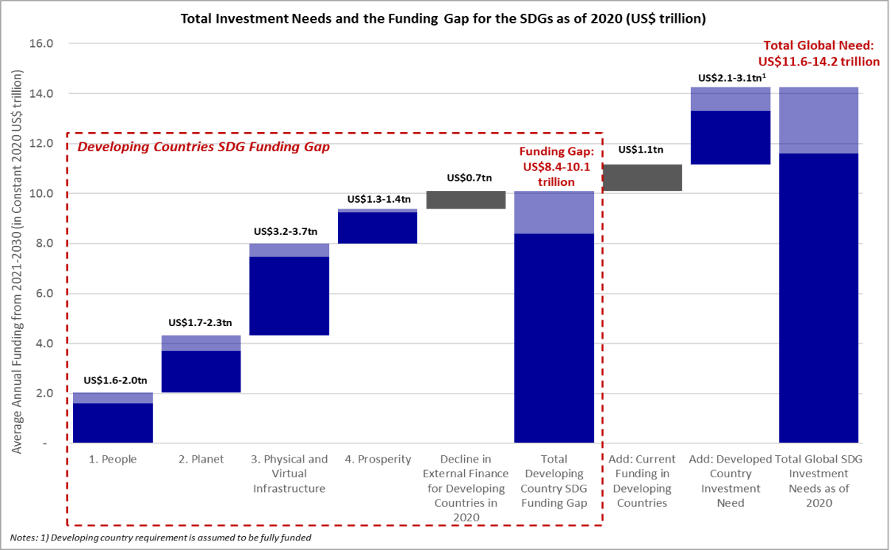
An analysis of current spending against the SDGs highlights that the overall volume of financing is insufficient but that its allocation is imperfect. In 2020, 40 of the world’s leading financial institutions that have committed explicitly to supporting the SDGs deployed a record total of US$2.1 trillion of capital in furtherance of the 17 goals (Figure 31). However, despite these record amounts, their stated priorities in terms of individual SDGs under their strategies, fiduciary and commercial mandates, and the distribution of their funding points to gaps for consideration, particularly on specific SDG goals.
For example, while climate-related goals account for c.22% of the total SDG funding requirement, they receive c.44% of the current SDG funding deployed. This is to be expected, given that a strong business case has been established for renewables and green investing. However, the total funding need still exceeds current commitments, and the climate targets are unlikely to be met (even with sufficient funding) if the other SDGs relating to uplifting the developing world economically and socially are not sufficiently addressed.
While most institutions do not specifically indicate the location of their sustainability investments, it is apparent from the analysis of the disclosed information that most of the current spending appears to be allocated to advanced economies. This is natural for many reasons ranging from the location of the financial institutions and where carbon polluting industries sit (given the concentration of SDG funding on climate goals), but it leaves developing countries with more outstanding shortfalls in investment to address other SDGs.
There is a significant shortfall in funding for human, economic, and social SDGs. The SDGs related to these goals are materially underfunded, accounting for c.40% of the total need but only 32% of actual current funding by finance industry leaders. As the shortfall is unlikely to be made up elsewhere – from local government transfers, charities, government aid, international organizations, and other stakeholders – these goals stand to be unmet.
Figure 31 SDG Focus and Spending by Finance Industry Leaders
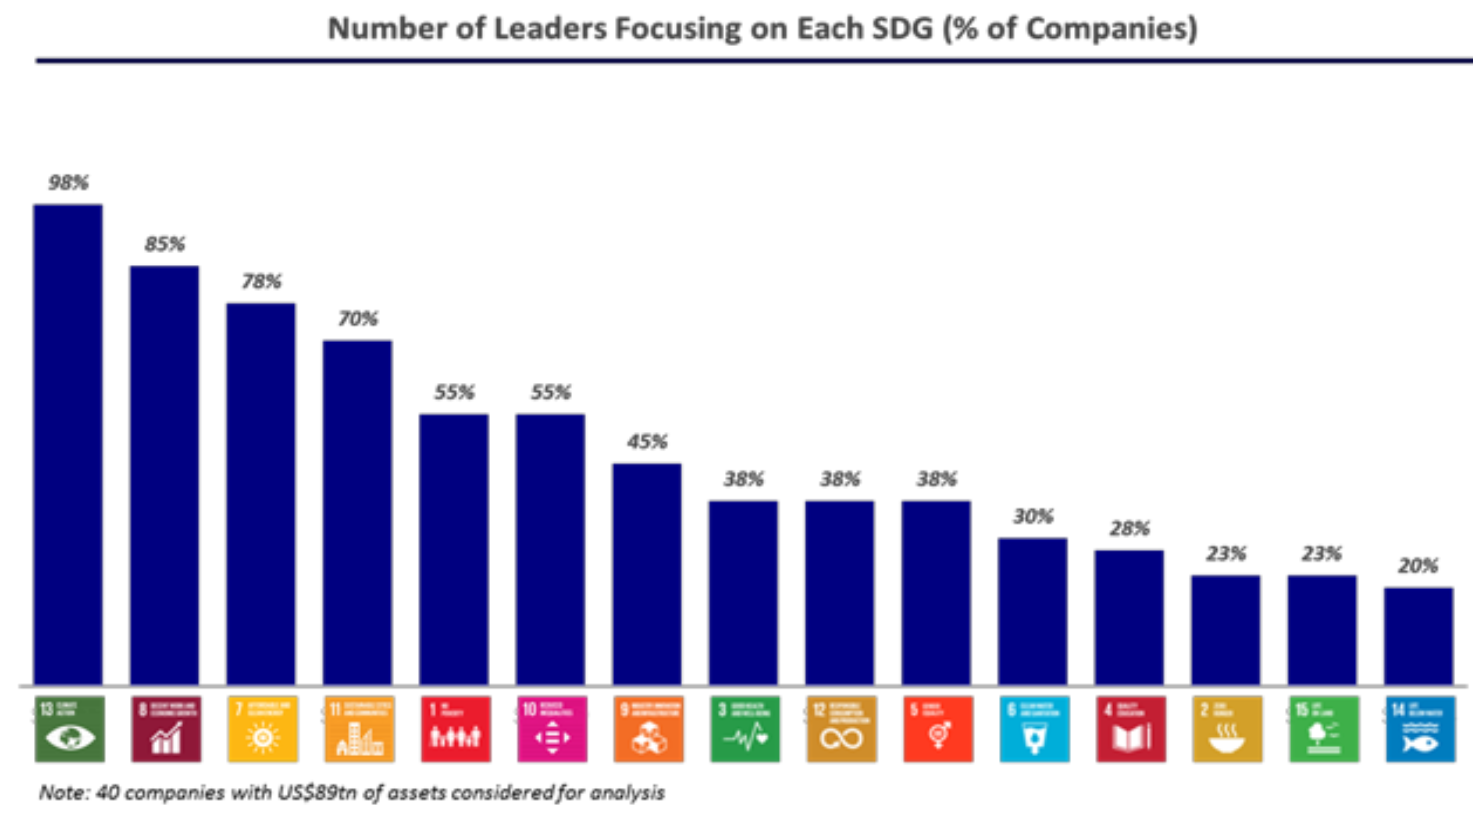
3.4.3. A Multi-Stakeholder Funding Effort, With an Overweight Role for the Finance Industry
Funding the US$84-101 trillion shortfall through 2030 is a challenge clearly beyond governments’ capacity and ability to support and will require private sector capital deployed at scale.
On the positive side, the largest global financial institutions are rapidly scaling their commitments in this regard through multi-pronged engagement strategies. They are making investments using increasingly comprehensive ESG tools promoting businesses and activities related to the goals, increasing their sustainability financing, and engaging with stakeholders more broadly, particularly in community financing, to drive inclusion and prosperity. In addition, a small number of the largest institutions are breaking new ground in this respect, engaging in a ‘race to the top’ in both the depth and breadth of their engagement by developing the business cases that allow them to deploy their capital for both profit and impact (see inset).
Race to the Top – Ground-breaking Commitments by Finance Industry Leaders
Trillion Dollar Financial Commitments to Drive the SDGs - US$7.0 trillion of capital committed to the SDGs (by five institutions)
Redefining Scale in Climate Change Commitments - US$690 billion mobilized for environmental finance (by ten institutions)
Driving Inclusion for Under-Served Communities - US$407 billion of community finance for sustainable and inclusive deployed (by ten institutions)
Championing Underfunded SDGs – US$104 billion of commitments targeting neglected SDGs focusing on ending hunger, delivering clean water, and cleaning the oceans
Prioritising Critical Social Issues - US$33 billion committed to advance racial equality over the next ten years (by five institutions)
However, while the finance industry, as the steward of over 85% of the world’s gross liquid assets, clearly has a critical role in funding sustainable development, it cannot solve the challenge alone, given the multi-stakeholder nature of both the SDGs and the financial system itself. For example, asset managers have a requirement to deploy capital following the mandates that clients sign up for, and these have parameters such as themes, sectors, geographies, returns, risks, and duration as part of the scope and limitations. Changing these factors is one that the client needs to be aligned on. Once the broad spectrum of specific issues is examined, it becomes apparent that solving the deployment of capital requires cooperation and is, therefore, a collective issue and needs a range of specific multi-stakeholder solutions.
Funding sustainable development and a transition to the future will require the coordination of governments, individuals, and private corporations beyond traditional financial services companies. Individuals own US$255 trillion of liquid assets and represent 80% of the world’s consumption. Acting collectively, the individual can mobilize systemic change and redirect the global flow of funds. Unlocking this collective action will likely require technology platforms, mainly social media platforms, which have built deep relationships with over half the world’s population, implying an essential role for ‘Big Tech’. Further, despite their limited direct spending capacity, both developed and developing country governments have vital roles in unlocking development investment from the private sector, acting as arbiters of policy and bridges and as enablers for private capital. Development finance institutions, for example, have long invested in projects and countries where the risk-return requirements of financial institutions and their clients have excluded the private sector and so have the depth of experience. They also have a clear mandate to drive capital towards sustainability and development and partner with the private sector finance industry by filling gaps where it is not viable for private financial institutions to provide funding alone.
However, efficient collaboration between these parties will require a shared blueprint of goals, deliverables, roles, and actions for the world to own. This would need to include new rules of engagement, new principles of competition and collaboration, new regulations of resource management, and fiscal and monetary policy principles while encompassing a diverse range of national strategies, power blocs, and international coalitions. Such global blueprints have traditionally been the remit of the UN, which has convened its member states to build consensus on the most significant issues facing the world and promote united action. Given the projected future flows of global capital, the UN will need to include the four major power blocs (initially the US, EU and China and, given its scale and rise, India) at an early point and will quickly need to expand beyond national governments to become a true global compact. However, existing political and economic structures are not on track to develop this blueprint for financing, despite its urgent priority.
3.4.4. Funding the Future – Key Themes for Execution and Investment
The capital to fund the SDGs, the future and the transition between the two cannot be mobilized as a charitable endeavor, funded by governments through taxes, or deployed at a loss by private sector investors. Hence, the vast majority of the world’s capital requires investment themes where profits are made at sufficient levels to reward bold action and risk-taking, allowing for reinvestment in the future while providing for employment, taxes, social security, and pensions today.
Taking a lesson from the business case for climate change, simplicity is critical, and these need to make the SDGs more accessible. The SDGs can be grouped into four crucial financial investment platform categories: people, planet, prosperity, physical and virtual infrastructure, and an enabling one that cuts across them all, peace and partnerships.
The macro investment themes, from the work of 2021 ‘Capital as a Force for Good: Capitalism for a Sustainable Future’ report, which conducted an extensive analysis of and engagement with 100 leading financial institutions, DFIs, tech companies and fintech businesses, indicating the scale of challenge and ambition required, whose funding will determine the shape of this global transition provide examples:
Platform. A better and more sustainable future platform for the world, including laying the foundations for the future. Key focus areas include:
-
Closing the SDG Funding Gap, investing US116-US$142 trillion, an additional US$84-101 trillion, over the next decade, with major financial institutions partnering with other stakeholders to adopt the SDGs, particularly the most neglected
-
Mobilizing the Individual, shaping the flows of US$49 trillion of annual household spending globally[22] as the individual becomes a responsible consumer and investor (reflecting the growing awareness and power of the individual as a collective and potential force for good)
-
Stakeholder Aligned and Resilient Companies, influencing the priorities of the majority of global companies not yet fully aligned to the SDGs[23] (reflecting the resilience that comes with businesses that are relevant to the values of sustainability in the world and ready to tap the US$12 trillion business opportunities associated with the SDGs)[24]
-
Radical Energy Breakthroughs, enabling a step-change in human civilization with energy sources that breakthrough in functionality while being clean, affordable, reliable, and abundant (funding the future energy for a new society).
People. Addressing basic human needs. Key focus areas include:
-
Food and Water Security, increasing global food production by 70% to meet rising demand by 2050, providing safe, nutritious, and varied food for 9.7 billion people (turning low productivity arable land into industrial-scale yield while maintaining farmer ownership)
-
Resilient Healthcare and Social Security Systems, caring for the 3.9 billion people lacking access to critical healthcare services (recognizing universal health and social security as a fundamental human right)
-
Mass Education and Skill Development, providing mass education, skills and better awareness and mental resilience using digital platforms to break the boundaries of location and local restrictions (a beyond schooling to a more inclusive, aware, and resilient population)
Prosperity. Creating shared prosperity. Key focus areas include:
- Mass Financial Inclusion, providing financial access and services to the 67% of the world’s population that remains un- or underbanked (beyond basic bank accounts to meaningful inclusion in the financial system)[25]
Planet. Saving the planet. Key focus areas include:
-
Mass Scaling of Existing Green Energy Solutions replacing the 83% of global energy still generated by fossil fuels[26] with renewables
-
Regeneration of the Environment and Ecosystem, renewing the 25% of global land that has been degraded[27] and cleaning cities and industries (enhancing the SDGs by also revitalizing urban and industrial environments for what has been destroyed, at scale) V. Physical and Virtual Infrastructure—enabling human activity.
-
Reimagined Urban Life, creating sustainable living for the 2.4 billion new urban inhabitants by 2050[28] in the face of migration within and across boundaries (beyond 2030, reflecting the rise in urbanization)
-
Global Digital Participation and Inclusion, providing inclusion to the over three billion people without internet access[29]^xi^ (a universal project beyond the agreed SDG goals of access to move forward together)
Realizing these themes holds the promise of a stable transition to a very different world from today’s sustainable information age. This world would be one of the universals – universal connectivity, universal inclusion, universal education, and universal healthcare access – eliminating hunger, illiteracy, diseases, and countless unnecessary deaths. Such a world would also be one of abundance – abundant food and water, abundant energy, and great essentials – eliminating absolute poverty and creating economic opportunities for all. And such a world would be one of balance – with regenerated ecosystems and artificial and natural environments operating in harmony, balancing biodiversity and thriving communities.
Footnotes
The six environmental objectives pursued in the EU Taxonomy are: (1) Climate change mitigation, (2) climate change adaptation, (3) sustainable use and protection of water and marine resources, (4) transition to a circular economy, (5) pollution prevention and control, and (6) protection and restoration of biodiversity and ecosystems. ↩︎
The Millennium Ecological Assessment (MEA) was a four-year multinational work program aiming to provide scientific knowledge on the relationships between ecosystem change and human well-being to decision-makers. Millenium Ecosystem Assessment looked at the effects that changes in the ecosystem have on human well-being. From 2001 to 2005, more than 1,360 experts from all over the world worked on the MA. Scientifically, their findings show how ecosystems and the services they provide are in a state of flux around the world. They also show how to protect and use them in a way that is healthy for the planet and for people. ↩︎
To take into account the impact of differences in household size and composition, the total disposable household income is “equivalised”. The equivalised income attributed to each member of the household is calculated by dividing the total disposable income of the household by the equivalisation factor. Equivalisation factors can be determined in various ways. Eurostat applies an equivalisation factor calculated according to the OECD-modified scale first proposed in 1994 - which gives a weight of 1.0 to the first person aged 14 or more, a weight of 0.5 to other persons aged 14 or more and a weight of 0.3 to persons aged 0-13. https://appsso.eurostat.ec.europa.eu/nui/submitViewTableAction.do. ↩︎
In total 47 studies have been omitted. In general, these studies present net present values, total economic values and monetary values that are hardly compatible with the type of values expressed in the studies under review. In addition, a small number of cases were omitted because the values were too high and thus represented outliers in the database. ↩︎
Fresh Water ecosystem was covered only by 14 studies in our sample, so it was grouped together with the Marine Ecosystem ↩︎
For example for Hungary which is classified as Pannonian, we set all the biogeographical dummy variables included in our model equal to 0.2. ↩︎
The Paris Agreement | UNFCCC 2030 Climate Target Plan | Climate Action (europa.eu)] ↩︎
Total greenhouse gas emission trends and projections in Europe — European Environment Agency (europa.eu) ↩︎
EU taxonomy for sustainable activities | European Commission (europa.eu) ↩︎
https://www.shareholdersforchange.eu/wp-content/uploads/2021/12/SfC-ENGAGEMENT-Report2021-DEF.pdf ↩︎
[https://group.intesasanpaolo.com/it/sostenibilita/ambiente/prodotti-servizi-verdi/Green-bonds.html] ↩︎
[https://www.sacesimest.it/media/comunicati-e-news/dettaglio-news/green-new-deal-una-nuova-missione-per-sace] ↩︎
https://www.borsaitaliana.it/notizie/focus-small-cap/strumenti/cosa-sono-i-minibond.htm ↩︎
https://www.climatebonds.net/resources/reports/2019-green-bond-market-summary ↩︎
https://www.eib.org/en/press/all/2019-313-eu-bank-launches-ambitious-new-climate-strategy-and-energy-lending-policy ↩︎
[https://in.reuters.com/article/us-ecb-policy-climatechange/in-green-shift-ecb-to-accept-and-buy-sustainable-bonds-idINKCN26D1C0] ↩︎
OECD, ‘Global Outlook on Financing for Sustainable Development 2021’ ↩︎
Force for Good: ‘Capital as a Force for Good: Capitalism for a Sustainable Future’, 2021 ↩︎
UNCTAD ‘World Investment Report 2014’ Estimates updated for global inflation 2014-2020 ↩︎
[IMF, 2020] Individual consumptions is the consumption by households and non-profit institutions serving households (NPISH) ↩︎
World Economic Forum: ‘UN Sustainable Development Goals: How Companies Stack Up’, 2021 ↩︎
Business & Sustainable Development Commission ‘Better Business, Better World Report’ 2017 ↩︎
The World Bank Group, The Global Findex database, retrieved 2021 ↩︎
BP, plc, 'Statistical World Energy Review 2021 ↩︎
United Nations Convention to Combat Desertification ‘Global Land Outlook (GLO)’, 2017 ↩︎
United Nations Conference on Housing and Sustainable Urban Development, Habitat III, 2016 ↩︎
Datareportal: Digital 2021 Report ↩︎