4. Sustainable Recovery and Resilience
4.1. Assessment of National RRPs and Comparison with Europe Sustainable Development Report 2021 Results
The European Union is among the pioneers pursuing the United Nations’ Agenda 2030. As explained in Section 1, EU leaders integrated the SDGs into the bloc’s formal annual procedures to coordinate national economic policies (the so-called European Semester process). In summer 2020, the EU responded to the challenges posed by the COVID-19 pandemic with a package of policies and funds to boost economic recovery while pursuing Europe’s green transition. Several countries worldwide have announced similar packages since the summer of 2020, and there are several ‘trackers’ that assess ex-ante their compatibility with environmental or broader sustainability objectives[1]. However, few other countries or regions have announced medium-term programs (and not annual budgetary plans), covering the entire economy (and not just packages for specific economic sectors) and addressing recovery spending (and not just monetary relief spending). Therefore, the EU’s approach can serve as a valuable case study to assess the consistency of short-and medium-term policy priorities with the officially declared long-term goals towards the sustainability transition.
The central part of the EU’s legally adopted recovery package provides funds to the Member States according to specific National Recovery and Resilience Plans (NRRPs). These Plans contain investments and reforms that national governments submitted to the European Commission, the EU’s executive body, in April and May 2021 (European Commission, 2021). Among other legal obligations, countries must align these plans with policy recommendations made by the Commission through the European Semester process. In addition, they must contain a minimum amount of funds devoted to climate policies and digitalization (at least 37% and 20% of the NRRP budget). However, EU countries were not obliged to align their NRRPs with SDGs. This lack of explicit linkage makes it challenging to assess whether the recovery packages indeed address all significant environmental, social and economic sustainability challenges in each country beyond the minimum requirements for climate- and digitalization-related spending.
This section presents a sustainability assessment of the NRRPs of seven South European Member States (Bulgaria, Croatia, Cyprus, Greece, Italy, Slovenia and Spain) submitted to the European Commission in spring 2021 and adopted by EU leaders in summer 2021. Altogether, they plan to receive more than 50% of the €338 billion grants made available by the EU’s Recovery and Resilience Facility and an equally substantial portion of the €386 billion to be provided through loans. The number of measures and amount of grants depends on the size of each country but also on the structure of each NRRP. For example, Croatia and Slovenia grouped their interventions (investments and reforms) in a small number of total measures (16 and 22 measures, respectively), whereas Spain has presented 396 measures. As a result, NRRP grants range between €1 billion (for Cyprus) and €69 billion (for Italy and Spain).
We mainly address how much each country’s NRRP contributes to SDGs and which The Plan insufficiently addresses SDGs. Although the several EU Member States have provided an SDG-related appraisal of their NRRPs, the assessment shown here goes beyond official reports by comparing this assessment with the country’s score in SDSN’s Europe Sustainable Development Report 2021 (ESDR), thereby underlining the gaps in policy design that need to be remedied by national authorities. It must be noted that the analysis for Italy and Spain has been adopted from ESDR 2021 (Lafortune et al., 2021), and the study for Cyprus comes from a broader assessment conducted for the country (Zachariadis, 2021).
For this purpose, the description of all measures included in the NRRP of each country was studied in detail, either from the original NRRP text submitted by the national government to the European Commission or from the Implementing Decisions published by the European Council after the approval of each NRRP. In addition, linkages of each measure with one or more SDGs were identified by connecting each action with one or more of:
-
The 169 targets of the SDGs
-
The 107 indicators that are used to compile the score of each SDG in ESDR
As a result, it was possible to create a matrix of (RRP measures x SDGs) per country and link the budget of each action with the corresponding SDG(s) that this measure addresses. Thus, the relevance of each country’s NRRP can be expressed in two ways: the number of NRRP measures addressing each SDG and the fraction of the NRRP budget devoted to each SDG.
Figure 32 provides the main results of the analysis by a number of measures per country, while Figure 33 demonstrates the aggregate analysis of the budget allocation of the NRRPs of all seven countries. Detailed findings and graphs per country are provided in Annex I.
Figure 32 Relevance of the recovery investments and reforms of seven EU Member States for each SDG.
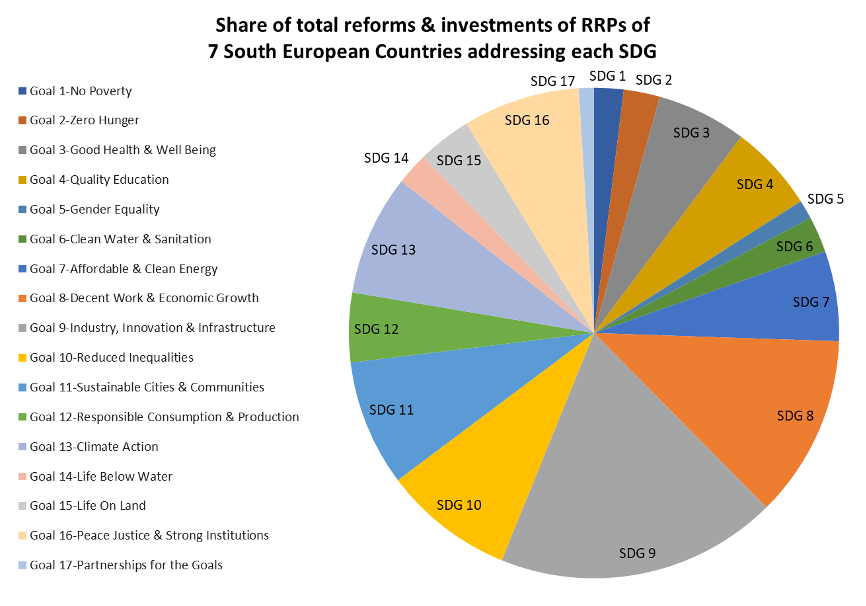
Overall, the analysis has found that all SDGs are addressed in the recovery plans, albeit to different degrees. SDGs that are mostly covered, in terms of several stimulus measures and budget allocated, are not always those on which countries face their biggest sustainability challenges. In particular, although several European nations demonstrate relatively poor performance in transforming food systems and diets and to biodiversity goals, these challenges have received lower attention in NRRPs than those related to other SDGs like green energy, electrification of transport, and energy efficiency measures. Although this misalignment is partly understandable because the ‘Next Generation EU’ package must be executed by 2026 and should therefore include ‘shovel-ready’ projects, the minor focus on systemic issues such as the agri-food sector and biodiversity calls for increased attention of EU nations to these topics through other post-pandemic public and private investments.
It is possible to expand the analysis by highlighting those measures of NRRPs which contribute to several SDGs. These can be regarded as ‘lighthouse’ interventions, i.e. those measures yielding a more significant sustainability impact. Although an exhaustive list is not provided here, the analysis has shown that some of the ‘best’ interventions in this regard contribute to several sustainability objectives simultaneously, e.g. modernising the economy, enabling the low-carbon low-pollution transition promoting social inclusion. At the level of individual measures, examples of such ‘lighthouse’ interventions are:
-
Research and innovation funding on green transition
-
Strengthening digital, green, blue and entrepreneurship skills of the unemployed or people over 55 and with particular emphasis on unemployed women
-
Upskilling the existing farmers’ community
-
Valorization of livestock waste and construction of biogas production units
-
Promoting renewables and individual energy efficiency measures and tackling energy poverty in households with disabled people.
Figure 33 Allocation of the recovery funds of the seven EU Member states analyzed to different SDGs.
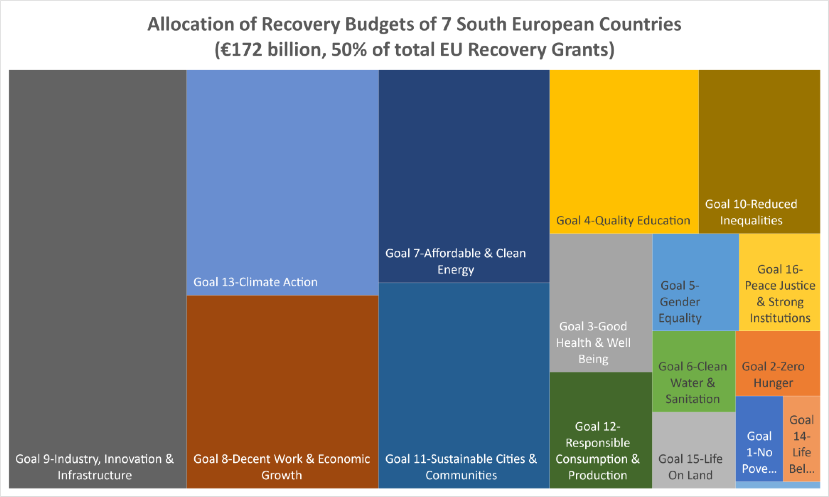
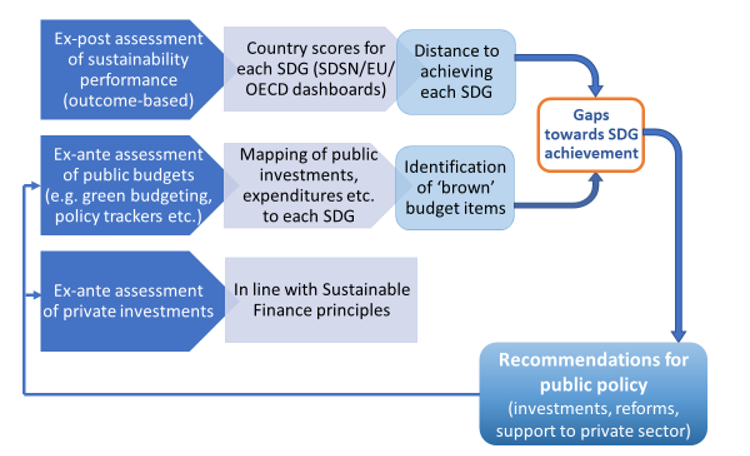
Figure 34 illustrates the broader framework in which this methodology can be applied. The first row corresponds to the outcome-based assessment of SDG scores as produced in ESDR 2021. Suppose one compares such an ex-post assessment with the ex-ante analysis (second row in Figure 28). In that case, it is possible to identify financing gaps and propose corrective actions for mainstreaming sustainability in national policies, both in public funding and in support of private sector investments. Primarily regarding support for private investments, this procedure can complement the rules that have partly been prepared and are partly under development in the EU Sustainable Finance initiative framework and can guide decision-makers and stakeholders.
Figure 34 Schematic framework for mainstreaming SDGs in national policies.
To the extent that an appropriate appraisal of an economic stimulus package, as outlined above, has been carried out, this framework should then be expanded and applied in all medium-term monetary policy plans of a country. In the EU, for example, NRRPs will be a significant source of funding for investments and reforms in the EU Member States up to 2026, but it will not be the only one; hence the analysis can be transferred and employed for all funds included in the regular EU budget, i.e. the so-called European Structural and Investment Funds. Similar plans worldwide, such as China’s 14th Five-Year Plan for 2021-2025 or the United States’ American Jobs Plan and the Infrastructure Deal decided during 2021, are examples where this framework can be effectively applied.
In 2020-2021, initiatives at OECD and EU levels put a strong focus on ‘Green Budgeting’ (OECD, 2020), which tracks the greenness of public budgets for one or more environmental objectives. This is an important starting point towards full consideration of SDGs in governmental actions, and national administrations that can go beyond Green Budgeting to ‘SDG Budgeting’ can offer a valuable service to the welfare of their societies. As suggested by Lafortune et al. (2020) and briefly shown here, it is possible to quickly identify gaps in the sustainability orientation of public policies by combining ‘outcome-based’ approaches such as SDG scores with forward-looking assessments of budgets that link all budget measures with SDGs and the Six Transformations. Figure 34 has provided a simple schematic of this framework, which, apart from public policies, can also be used for the targeted support of private investments.
4.2. The Coronavirus Pandemic, Assessment of Resilience[2]
The coronavirus pandemic has swept across most of the world, leaving a trail of human and economic destruction. In this crisis, the ‘enemy’ is a silent, invisible and deadly pathogen that has successfully overcome border protections. It has been able to exploit the world’s interconnected and networked economies and societies to spread worldwide and threaten people’s way of life, testing the resilience of public health and economic systems. The evidence suggests that defeating it requires mass mobilization of healthcare resources and financial tools and community and individual action within and across countries of the kind that has usually been seen only during periods of war or significant economic dislocation.
The pandemic has revealed many cracks in the world’s existing political, economic and governance systems, including public health, international cooperation, monetary flexibility and government effectiveness. These cracks are the results of a series of deeper underlying issues facing the world today, including the problems facing inequitable and disparate public healthcare systems within and between countries; unaddressed market and regulatory issues; the loss of political cohesion stemming from populist, isolationist and exceptionalist politics across the world, and; demographic challenges facing industrialized countries with large elderly populations.
The assessment, undertaken in April 2020 to provide risk assessments that might aid policymakers, examined the capability to resist and act to address the pandemic, with a primary focus on the resilience of eight major countries, along with five resilience factors (Table 16):
-
Population and Demographic Risk.
-
Healthcare and Social Protection.
-
Economic Strength Against Macro-Shocks.
-
Policy Capacity for Economic Stimulus.
-
Global Coordination, Collaboration and Cohesion.
Table 16: Qualitative Summary of Resilience Indicators: Major Nations Ill-Prepared for Global Pandemic
| US | China | India | Germany | France | UK | Italy | Japan | |
|---|---|---|---|---|---|---|---|---|
| Resilience Factor 1: Population and Demographic Risk[3] | ||||||||
| At-Risk Population | ||||||||
| Risk of Spread | ||||||||
| Poverty/Inequality | ||||||||
| Communication and Information (Credibility) | ||||||||
| Resilience Factor 2: Healthcare and Social Protection[4] | ||||||||
| Critical Care Capacity | ||||||||
| Virus Testing | ||||||||
| Social Protection for Job Loss | ||||||||
| Healthcare Access and Quality | ||||||||
| Resilience Factor 3: Economic Strength Against Macro Shocks[5] | ||||||||
| Economic Growth | ||||||||
| Unemployment Rate | ||||||||
| Informal Employment | ||||||||
| Corp/Household Indebtedness | ||||||||
| Structural Risk | ||||||||
| Resilience Factor 4: Policy Capacity for Economic Stimulus[6] | ||||||||
| Monetary Policy | ||||||||
| Ability to Introduce Stimulus | ||||||||
The analysis revealed that almost all significant countries examined are significantly underprepared for the potential impact of COVID-19 from multiple perspectives. Some of the key figures are extracted in Table 17:
Table 17: Summary of Resilience to Coronavirus Pandemic for Major Countries (Sub-set of Parameters[7] from 15 Key Quantitative Indicators for Four Major Areas)
| Population and Demographic Risk | Health care and Social Protection[8] | Economic Resilience Against Macro-Shocks | Policy Capacity for Economic Stimulus | |||||||||
|---|---|---|---|---|---|---|---|---|---|---|---|---|
| Country | Pop. without Health Insurance[9] | % of Pop. Below Poverty Line[10] | % of Pop. Aged 65+[11] | Hospital Beds / 1,000 people[12] | Testing Capacity per Week / million Pop.[13] | % of Unemployed Receiving Benefits[14] | Historic GDP Growth Rate[15] | Informal Employment[16] | Corp. Debt to GDP[17] | Fiscal Deficit as % of GDP[18] | Gov. Debt as % of GDP[19] | Sovereign Credit Rating[20] |
| US | 9% (45%) | 1.2% | 15.8% | 2.8 | 761 | 28% | 2.6% | 18.6% | 150% | -4.6% | 107% | AAA |
| China | 5% | 23.5% | 10.9% | 4.2 | NA | 19% | 6.5% | 54.5% | 208% | -4.2% | 51% | A+ |
| India | 56% | 60.4% | 6.2% | 0.7 | 58 | 3% | 6.7% | 88.2% | 55% | -3.3% | 68% | BBB- |
| Germany | 0% | 0.2% | 21.5% | 8.3 | 4,581 | 100% | 1.5% | 10.2% | 111% | 1.5% | 62% | AAA |
| France | 0% | 0.1% | 20.0% | 6.5 | 444 | 95% | 1.7% | 9.8% | 201% | -3.0% | 98% | AA |
| UK | 0% | 0.5% | 18.4% | 2.8 | 412 | 60% | 1.5% | 13.6% | 171% | -1.8% | 87% | AA- |
| Italy | 0% | 1.5% | 22.8% | 3.4 | NA | 38% | 0.9% | 19.0% | 110% | -1.6% | 135% | BBB |
| Japan | 0% | 0.9% | 27.6% | 13.4 | 415 | 20% | 1.2% | 18.7% | 161% | -3.8% | 237% | A |
When the resilience indicators are looked at as a whole, they reveal that the world was critically ill-prepared for Covid-19, creating significant risks to human life and severe damage to substantial economies. While there were substantial gaps between the levels of resilience of individual countries, all major countries lacked preparedness to deal with a pandemic on the scale of Covid-19, along multiple fronts, with the data highlighting the following:
-
The US was severely exposed due to systemic shortcomings and structural factors. Large segments of the US population were critically exposed due to a lack of adequate long-term healthcare cover. In addition, US economic stability rested on its ability to increase the money supply (and co-opting its banking system, subject to its markets playing along), which seemed feasible. Given its near-zero interest rates, a high fiscal deficit and indebtedness at the level of the Global Financial Crisis, the US would likely need to rely on effectively printing money in what may be seen as a ‘heroic’ or desperate fashion, depending on one’s perspective, to shore up its economy.
-
Aside from Germany, Europe was also exposed, with the UK’s situation appearing to be particularly vulnerable and therefore much at risk from poor policy and any failures in the execution of proper measures.
-
India emerged as the most at risk, given its size, population density and development stage. So, it had the most critical need for radical solutions covering multiple areas, including emergency healthcare and economic and social measures.
-
China’s overall resilience was one of the strongest, and so it stood to emerge in a relatively superior position from this crisis.
-
Threats to the successful implementation of sound policy existed from the lack of adequate, reliable public information and a ‘populist’ approach. The prevalence of unreliable news on social media made clear and efficient communication a challenge in countries where trust in mainstream media is low and social networks are the primary source of information for the population, particularly given the alleged existence of targeted disinformation campaigns underway and the populist stances of confident political leaders.
-
Global coordination, collaboration and cohesion[21] were not of the level required for a pandemic, particularly given the US administration’s political positions on the pandemic and its ‘America First’ program, which had affected its leadership position. However, major international institutions, such as the World Bank and IMF, UN and WHO, were better funded relative to the global financial crisis. However, the US was not exerting the same leadership in these as during the global financial crisis. Central Banks also had substantial stocks of reserves to make interventions.
The work concluded that given the significant gaps in resilience and preparedness of countries, and the urgency of actions required, these could only be addressed by working together across boundaries and effectively within countries, cooperating to galvanize people and resources, including the vast body of knowledge in the world on medical illnesses, managing crises (most recently, from the Global Financial Crisis, 9/11 and multiple wars from the last century), the on-the-ground peace and aid experience of numerous international institutions and the strong legacy of post-war allied leadership.
4.3. How Recovery Spending is aligning with needs in a net-zero scenario and the projected impacts on energy employment
In June 2021, the International Energy Agency (IEA) produced its landmark Net Zero by 2050 (NZE) scenario which lays out a roadmap for the global energy sector to reduce emissions in line with what is needed to limit global surface temperature rise to 1.5oC by the end of the century.[22] In the World Energy Outlook 2021, the IEA compared how countries’ pledges to reach net-zero compared with this roadmap in its Announced Pledges Scenario (APS), which included European countries’ collective and individual pledges.[23] Globally, these pledges are now sufficient to limit global warming to 1.8oC by 2100—the first time that governments have come forward with targets of sufficient ambition to hold global warming to below 2 °C. However, 1.8 °C is still above the Paris Agreement target of limiting global warming to well below 2 °C and pursuing efforts to limit it to 1.5 °C. Furthermore, as of November 2021, today’s policies and implementation still lag countries’ announced pledges sufficiently, and ambitions in the critical period from now to 2030 still leave a 70% gap in the amount of emissions reductions needed by 2030 to keep 1.5 °C within reach (IEA, 2021).[24]
Some countries have used their economic recovery packages in response to the Covid-19 packages to bring implementation closer in line with these targets while rebooting their economies and putting people back to work. In this section, we explore how global recovery packages align with levels of spending needed to support the world in its shift to a net-zero by 2050 trajectory. We also explore how these ambitions are beginning to reshape global energy employment and how countries are parlaying recovery packages into successful industrial policies to support an emerging new energy economy.
4.3.1 Recovery spending and its impact on a green recovery
From the outset of the pandemic, national governments have mobilized an unprecedented amount of fiscal support to manage the impacts of the crisis on citizens and the global economy.[25] In total, Covid-19-related fiscal outflows have grown to an unprecedented USD 18.2 trillion worldwide. Many of these measures focused on liquidity support for vulnerable businesses and workers and supporting health care provisions.
The IEA’s Sustainable Recovery Tracker—which covers more than 1,000 policies and measures related to sustainable recoveries—estimates governments have committed so far over USD 710 billion to long-term sustainable recovery measures by 2030, a 50% increase from the amount recorded in the IEA Sustainable Recovery Tracker in October 2021 (IEA, 2022).[26] This lifts the fiscal response directed to sustainable recoveries to unparalleled levels, nearly 40% above the amounts earmarked for clean energy and the environment in the national stimulus plans after the 2008-2010 global financial crisis (OECD, 2020). This corresponds to about 4% of the total fiscal support unleashed in response to Covid-19 worldwide (Figure 35). This corresponds to about 43% of the total fiscal support unleashed in response to Covid-19 worldwide (Figure 35). This corresponds to about 4% of the total fiscal support unleashed in response to Covid-19 worldwide (Figure 35).
Figure 35 Long term economic and sustainable recovery spending, as of the end of March 2022
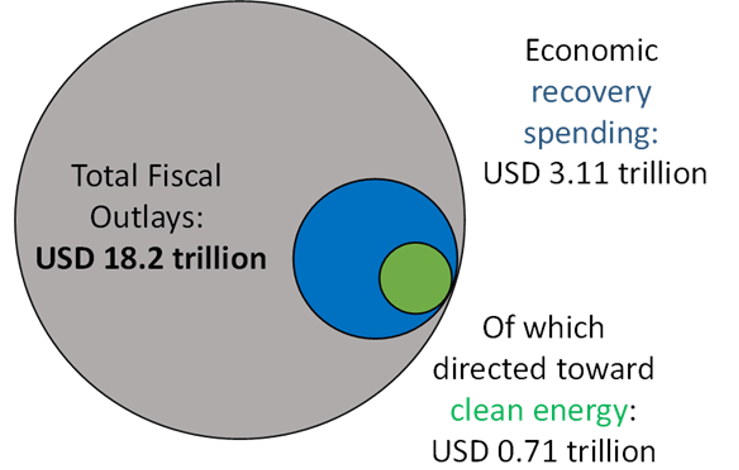
As of the end of March 2022, governments had spent around USD 710 billion on sustainable recovery measures as part of their response to the pandemic, around 4% of the total fiscal response
A closer look at regional spending profiles reveals concerning imbalances. In advanced economies, governments have now earmarked amounts nearly aligned to the short-term spending levels needed to be on track for net-zero emissions by mid-century. However, this spending still needs to find its way to the real economy, and much greater efforts are required beyond 2023 for spending levels to remain broadly in line with the Net Zero Emissions by 2050 Scenario. The packages that contributed the most to sustainable recovery measures are the American Infrastructure, and Jobs Act and the France 2030 investment plans, followed by Australia’s Long-Term Emissions reduction plan and the supplementary Japanese national budgets voted for the period 2020/2021 and 2021/2022.
EMDEs governments have earmarked ten times less spending for sustainable recoveries in total and less than a quarter of what would be needed in the short term to be on track with the Net Zero Scenario (Figure 36). International catalysts like development assistance could be vital to increasing clean energy investment in emerging and developing economies (IEA, 2021).[27]
Figure 36 Government sustainable recovery spending earmarked to 2023, by region, compared to short-term Net Zero Scenario levels IEA. All rights reserved.
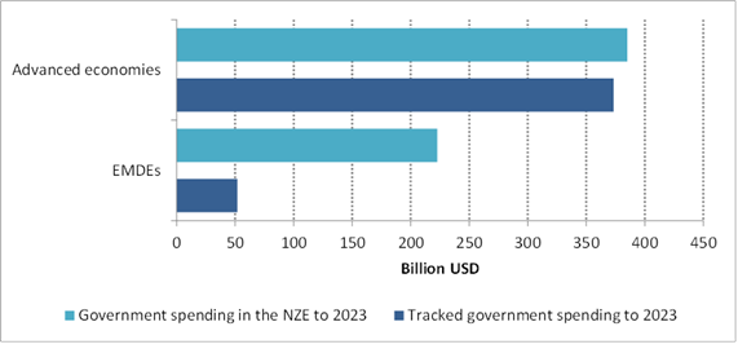
Advanced economies are nearing levels needed to shift trajectories toward net-zero, but emerging and developing economies are only at 20% of the levels and face narrowing fiscal options as the pandemic wears on.
Figure 37 Additional investment expected to be mobilised by government spending by sector compared with Net Zero Scenario levels IEA. All rights reserved.
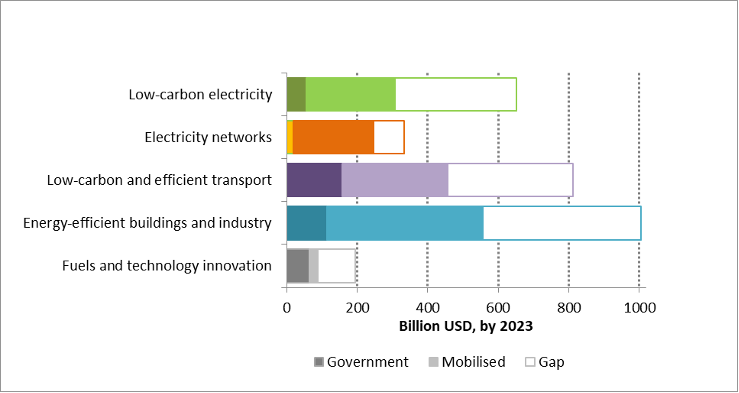
All key sectors saw increases in government spending. However, the balance across these sectors in each geography could result in fewer emissions reductions than if these measures were carried out proportionally.
The unprecedented global sustainable recovery effort by governments will only bear fruit if most of the earmarked spending reaches market actors during the crucial 2021-2023 recovery period. Long lead times in project development and implementation delays could threaten these objectives. Governments need to focus on setting up programs to award grants, select contractors or subsidy recipients. One crucial aspect is consumer-facing spending — such as the USD 72 billion available for energy efficiency retrofits between now and 2023—making households aware of the available offer and supports and taking down administrative barriers should be key endeavors for policymakers.[28]
Russia’s invasion of Ukraine has further thrust global energy markets into uncertainty and reinforced supply chain bottlenecks born from global lockdown implementations. The impact of these disruptions on shipping and manufacturing costs may also cause projects to be shelved or scaled back. Labor shortages are a continuous challenge. Government spending programs should urgently consider and address these limitations.
4.3.2 Clean energy transitions’ impacts on energy employment
Aligned with recovery spending and countries’ long-term pledges to reach net-zero, employment in clean energy and related sectors is expected to grow substantially, more than offsetting a decline in traditional fossil fuel supply sectors. We estimate that an additional 13 million workers will be employed in clean energy and related sectors by 2030 in the IEA’s Announced Pledges Scenario, which doubles in the IEA’s Net Zero Scenario (Figure 38).
Growth will be most notable in renewable power generation, energy networks, energy efficiency (retrofits and energy‐efficient appliances), and car manufacturing (efficient vehicles and EVs). These are particularly dramatic if the world is to hit net-zero by 2050—as detailed in the IEA’s Net Zero Emissions by 2050 scenario.[29] However, even under today’s announced pledges (represented in the IEA’s Announced Pledges Scenario, marked shifts are seen, albeit more gradual, with sharp regional variations.[30]
Figure 38 Employment growth in clean energy and related areas to 2030 IEA. All rights reserved.
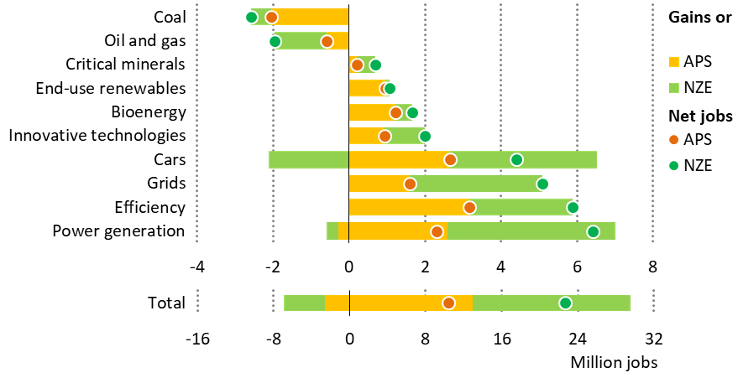
Clean energy job gains outpace losses in fossil fuels jobs in the APS and job
growth in clean energy and related segments doubles in the NZE
The new jobs created in the energy transition are not necessarily made in the same places and sub-sectors where jobs are lost. Skill sets are not automatically transferable, and new skills are needed. This is true within single countries and internationally. Accordingly, governments have a vital role in managing these impacts in a coordinated way. Naturally, governments will seek to design transition pathways that maximize opportunities for new, high-quality jobs that align with existing strengths or skill sets and mobilize long-term support for workers and communities where jobs are lost. Getting this right typically means robust social dialogue among employers, workers, communities, international organizations and governments. Again, governments need to manage the impacts in a coordinated way, seeking long-term transition planning.
Many countries are looking to retool their economies to maximize the employment growth benefits within their countries, and have been a prominent aspect of recovery plan spending. Most clean energy jobs are created close to the project’s location, whether a wind farm or new energy-efficient housing. However, we estimate that a quarter of energy employment is tied to supply chains that may be located in other countries, particularly for solar, wind, batteries, grid components, and vehicle components. However, the prominence of these supply chains is not fixed over time, as a new manufacturing capacity is needed to meet the growing demand for these technologies as spending grows 1.6-fold over the next decade to keep pace with countries’ announced pledges.
Many governments, especially in advanced economies, are mobilizing economic recovery funds to bolster home-grown industries for mature technologies like solar, wind and EVs, or making strategic investments in emerging segments, like CCUS, batteries, advanced biofuels, and hydrogen. These latter industries, although nascent today, will grow to employ nearly 1 million workers worldwide by 2030 in the Announced Pledges Scenario.[31]
Announced pledges also have consequences for jobs in fossil fuel employment. The Announced Pledges Scenario does not mark the end of coal-fired power generation, but it has clear implications for coal-related employment, particularly in mining, where the opportunities for worker transition are more limited than in the power sector. Direct coal-related jobs are set to continue the declines seen over the past decade, driven by environmental and demand pressure, especially in advanced economies and increased productivity, particularly in Asia. By 2030, 30% fewer people will work in coal than in 2019; one-third of those declines are associated with productivity gains in coal mining. The drop is most notable in China, although this is mainly the result of continued restructuring in the industry rather than lower demand (Figure 39).[32] Coal employment in India, which has the second-largest number of coal workers worldwide, could be bolstered by the policy ambition to increase domestic output, but there are significant uncertainties over domestic demand, especially if policies tighten.
While energy transitions create substantial job growth on the net, there are limits to which jobs lost in traditional sectors can be transitioned to clean energy on a one-to-one basis. Rising demand for critical minerals offers some transfer of employment in the mining sector, but these opportunities are not always located in the same area as coal supply. Miners working at fully modernized mines have skills that could be readily transferred. However, over 90% of coal miners are in emerging market and developing economies and are often unskilled and have historically usually transferred to other sectors of the economy as mines closed, notably in China. Most of the scope to re-deploy existing workers to new clean energy projects in practice is in the oil and gas sector. Coal employment is only a tiny portion of total employment in most countries (less than 0.5% in China and less than 0.1% in India), but it accounts for a high percentage of total earnings and tax revenues in many communities. There is a need to help workers and communities where coal plant closures are likely to have cascading effects on communities and supporting businesses.[33]
Figure 39 Changes in fossil fuel employment and energy areas with overlapping skills in the Announced Pledges Scenario to 2030 IEA. All rights reserved.
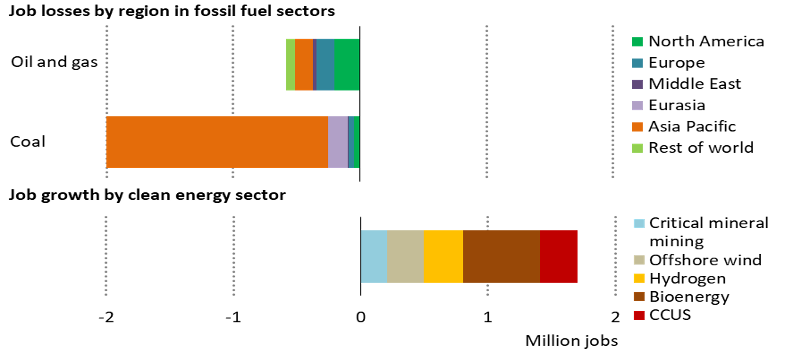
Skilled fossil fuel workers have opportunities to transition to clean energy jobs,
though the options are not a direct match for most coal sector jobs lost in Asia
Long-term planning can minimize immediate adverse impacts and provide time to retrain workers and people in the community. However, proper long-term planning requires wide-stakeholder participation, with labor unions being of particular importance (see the section on coal phase-out below).
By 2030, the Announced Pledges Scenario anticipates that oil and natural gas employment will decline gradually from today’s levels with small decreases, with the significant cutbacks in the workforce in 2020-21 already bringing headcount to levels roughly in line to meet projected oil and gas demand in 2030.[34] Nonetheless, many parts of the oil and gas industry are already focused on diversifying their workforce, ensuring they retain critical skills while applying current capacities to emerging industries. Russia’s invasion of Ukraine and the ensuing oil and gas market disruptions underscores this point. Traditional oil and gas knowledge and skills will remain important through the transition, as nimbly responding to distributions to the security of supply is critical to ameliorating public perception risks that could threaten an orderly clean energy transition. However, many workers within the oil and gas industry possess skills that can find a place in the new energy economy, particularly skills related to large-scale project management expertise, engineering services, offshore and sub-surface projects, logistics, trade and finance. These skills are of immediate relevance to clean technology areas, such as offshore wind, CCUS, hydrogen, geothermal, biofuel production, and low-carbon gasses (Figure 39).
Accounting for these jobs and skills needs is of great importance for decision-makers as they shape clean energy transitions. Governments who have invested in more granular energy labor reporting have seen the benefits by better informing transition planning and plan for education and skills development programs and redeployment initiatives. Best-in-class examples of such reporting include the United States Energy Employment Report, which assesses all energy employment down to the sub-sectoral level and across all parts of the energy value chain (i.e. from raw materials to decommissioning).[35]
Footnotes
See e.g. the Sustainable Recovery Tracker of the International Energy Agency, also highlighted in Section 4.3 of this report, the OECD Green Recovery Database, the Global Recovery Observatory of the Green Fiscal Policy Network, the Greenness of Stimulus Index, the European Green Recovery Tracker, CarbonBrief’s Green Recovery Tracker and others. ↩︎
Ketan Patel, Christian Hansmeyer et al. Summarised and extracted from, ‘The Coronavirus Pandemic - A Global Test of Resilience, Leadership and Values, April 2020’ and ‘The Coronavirus Pandemic - Waging the War, May 2020’, with permission from the authors, Greater Pacific Capital Research, specifically authors Ketan Patel, Christian Hansmeyer et al. ↩︎
Resilience Factor 1: Population and Demographic Risk. Risk Summary: The US stands out as among the most vulnerable from the perspective of its population, demographics and long-term provision of healthcare to its mass population. At the other extreme, India as a large developing country also faces enormous challenges. ↩︎
Resilience Factor 2: Healthcare and Social Protection. Risk Summary: On the protection offered by the healthcare system for the population, the US stands out as the most vulnerable for its people among richer countries (its excellent cover for the well-insured notwithstanding) given its lack of testing capabilities, relative size of its hospital infrastructure, and the quality and breadth of general healthcare access. The UK stands out among the same group for its inadequate healthcare capacity but does and has provided cover for all over a long period. And India, as a developing country, has the least medical capacity to deal with such a crisis and is therefore the most exposed as a result, and so critically subject to the effectiveness of its containment and suppression measures ↩︎
Resilience Factor 3: Economic Strength Against Macro-Shocks. Risk Summary: While low growth and high levels of corporate and household indebtedness poses a risk to the US and UK on both and China, France and Japan are particularly exposed on corporate indebtedness, weak structural employment is likely to put pressure on the US in a prolonged downturn, just as Italy’s dependence on these services is disproportionately impacting its economy during its lock-down. ↩︎
Resilience Factor 4: Policy Capacity for Economic Stimulus. Risk Summary: The developed world is highly constrained in terms of headroom for monetary stimulus compared to during the Global Financial Crisis, increasing the importance of fiscal stimulus at a time when major countries, particularly the US and Italy, are already running deficits and high debt levels well above the levels seen before the crisis. However, given the potential extent of the fallout being created by the coronavirus this may not constrain them from injecting money supply into their economies and taking the impact on currencies and inflation, thereby diluting the qualities of their economies as a result. ↩︎
Key metrics have been highlighted to illustrate the assessment of resilience; please refer to the complete paper for detailed metrics ↩︎
As of late March 2020 ↩︎
Source: OECD ↩︎
Source: Word Bank, % of the population in 2011 earning less than US$3.20/day ↩︎
Source: World Population Review ↩︎
Source: OECD, American Hospital Association ↩︎
Source: 2020, AEI, Institute, India Health Ministry, Public Health England, France-Director General of Health, German Health Ministry ↩︎
Source: ILO ↩︎
Average GDP growth from 2017 – 2019; Source: IMF ↩︎
Source: ILO ↩︎
Source: IMF ↩︎
Source: US Treasury, Reserve Bank of India, Federal Statistical Office, INSEE, Office for Budget Responsibility – UK, Japan Ministry of Finance, China Ministry of Finance ↩︎
Source: IMF ↩︎
Source: Fitch Rating Agency ↩︎
Resilience Factor 5: Global Coordination, Collaboration and Cohesion. Risk Summary: Major international financial institutions such as the World Bank and IMF are better funded relative to the global financial crisis, major global policy institutions such as the UN and WHO are also better financed than at that time. However, the US power is shifting away. The WTO has an important role in providing a level playing field. Central banks have substantial stocks of reserves to make international interventions, the highest risk in terms of reserves were the US, UK and Italy, with China far stronger than all others. There was an important additional role for charitable and NGO funds to play in supporting relief efforts. ↩︎
International Energy Agency: 'Net Zero Emissions by 2050 Scenario (NZE), https://www.iea.org/reports/world-energy-model/net-zero-emissions-by-2050-scenario-nze ↩︎
International Energy Agency: 'Announced Pledges Scenario (APS), https://www.iea.org/reports/world-energy-model/announced-pledges-scenario-aps ↩︎
International Energy Agency: ‘COP26 climate pledges could help limit global warming to 1.5°C, but implementing them will be the key’, https://www.iea.org/commentaries/cop26-climate-pledges-could-help-limit-global-warming-to-1-8-c-but-implementing-them-will-be-the-key ↩︎
- ↩︎
International Energy Agency, ‘Sustainable Recovery Tracker’, https://www.iea.org/reports/sustainable-recovery-tracker ↩︎
International Energy Agency, ‘Sustainable Recovery Tracker: Key Findings’, https://www.iea.org/reports/sustainable-recovery-tracker/key-findings ↩︎
International Energy Agency, ‘Sustainable Recovery Tracker’, https://www.iea.org/reports/sustainable-recovery-tracker/tracking-sustainable-recoveries ↩︎
International Energy Agency: 'Net Zero Emissions by 2050 Scenario (NZE), https://www.iea.org/reports/world-energy-model/net-zero-emissions-by-2050-scenario-nze ↩︎
International Energy Agency: 'Announced Pledges Scenario (APS), https://www.iea.org/reports/world-energy-model/announced-pledges-scenario-aps ↩︎
International Energy Agency: 'Announced Pledges Scenario (APS), https://www.iea.org/reports/world-energy-model/announced-pledges-scenario-aps ↩︎
International Energy Agency: ‘World Energy Outlook 2021’, https://www.iea.org/reports/world-energy-outlook-2021/phasing-out-coal ↩︎
International Energy Agency: ‘World Energy Outlook 2021’, https://www.iea.org/reports/world-energy-outlook-2021/phasing-out-coal ↩︎
International Energy Agency: 'Announced Pledges Scenario (APS), https://www.iea.org/reports/world-energy-model/announced-pledges-scenario-aps ↩︎
National Association of State Energy Officials: United States Energy Employment Report 2021, https://www.usenergyjobs.org/ ↩︎